> ## Documentation Index
> Fetch the complete documentation index at: https://docs.elementary-data.com/llms.txt
> Use this file to discover all available pages before exploring further.
# Incident Management
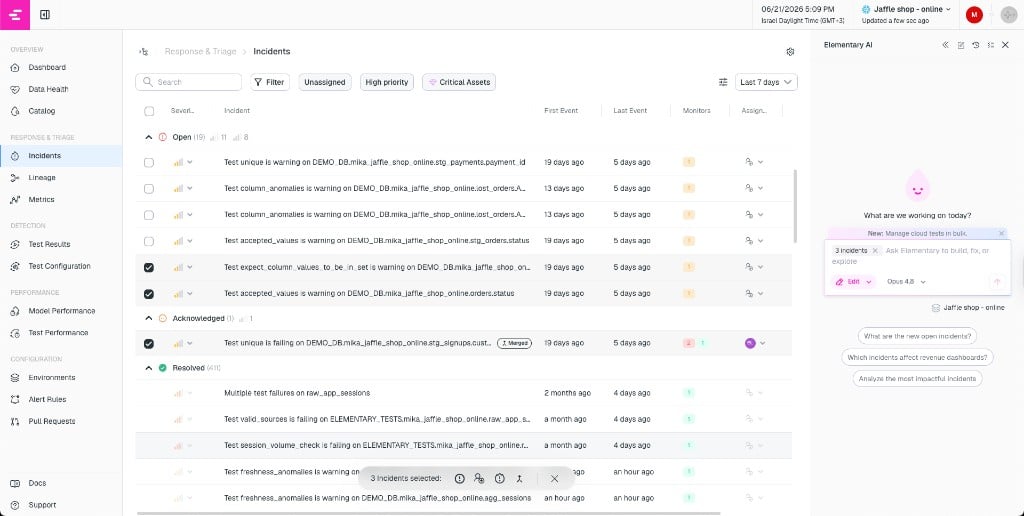
The Incidents page is designed to help your team stay on top of open incidents and collaborate on resolving them. It provides a comprehensive overview of all current and past incidents, where users can view the status, prioritize, assign, and resolve incidents.
## Incidents list
Incidents are organized in a grouped table with three sections: **Open**, **Acknowledged**, and **Resolved**. Each group header shows a count of incidents and a breakdown by severity.
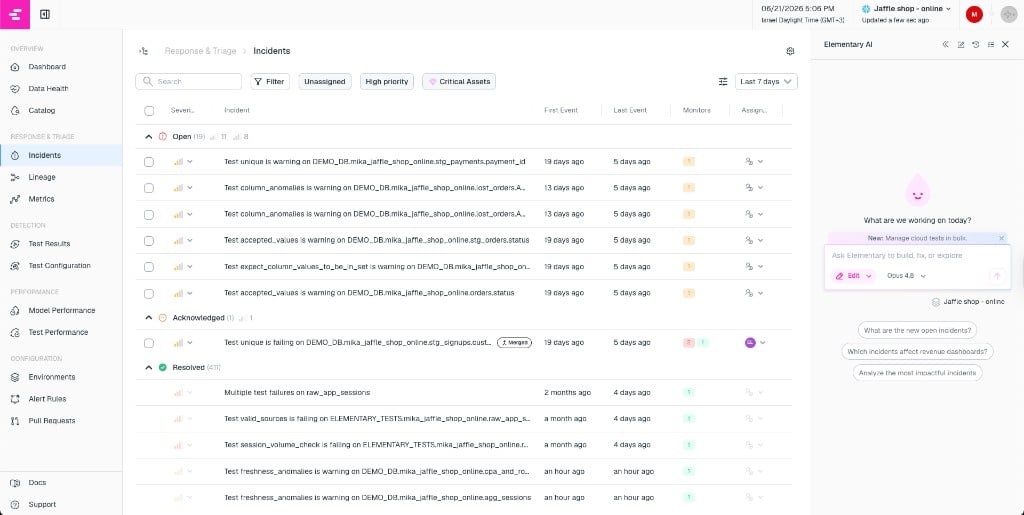 The table columns include:
* **Severity** — editable inline via dropdown
* **Incident** — title, with a "Merged" chip for incidents containing multiple monitors
* **First Event** / **Last Event** — when the incident started and when the last failure occurred
* **Monitors** — status chips showing pass/fail/warning counts
* **Assignee** — editable inline, searchable dropdown
* **Status** — editable inline
Columns can be toggled on or off via the column menu. You can sort by severity, first event, last event, monitor count, or assignee.
## Filtering
The incidents page provides several ways to scope your view:
* **Search** — full-text search across incident titles
* **Filters** — severity, assignee, owner, database/schema/table, critical asset, and monitor count
* **Quick filters** — preset combinations for common views:
* **Unassigned** — incidents with no assignee
* **High priority** — unassigned incidents with High or Critical severity
* **Critical Assets** — incidents on assets marked as critical
* **Merged** — incidents with more than one monitor (result of a merge)
* **Days back** — adjust the time window (default: 3 days)
* **Tree selection** — select a folder, asset, or test in the left navigation tree to scope the list
## Incident detail
Clicking an incident row opens a detail drawer on the right side of the screen.
### Header
The top of the drawer shows the incident title, metadata chips (assignee, status, severity), duration, and the number of failing monitors. You can also:
* Edit the title
* Add or edit a summary
* Link or create tickets (Jira, Linear, ServiceNow, etc.)
### Tabs
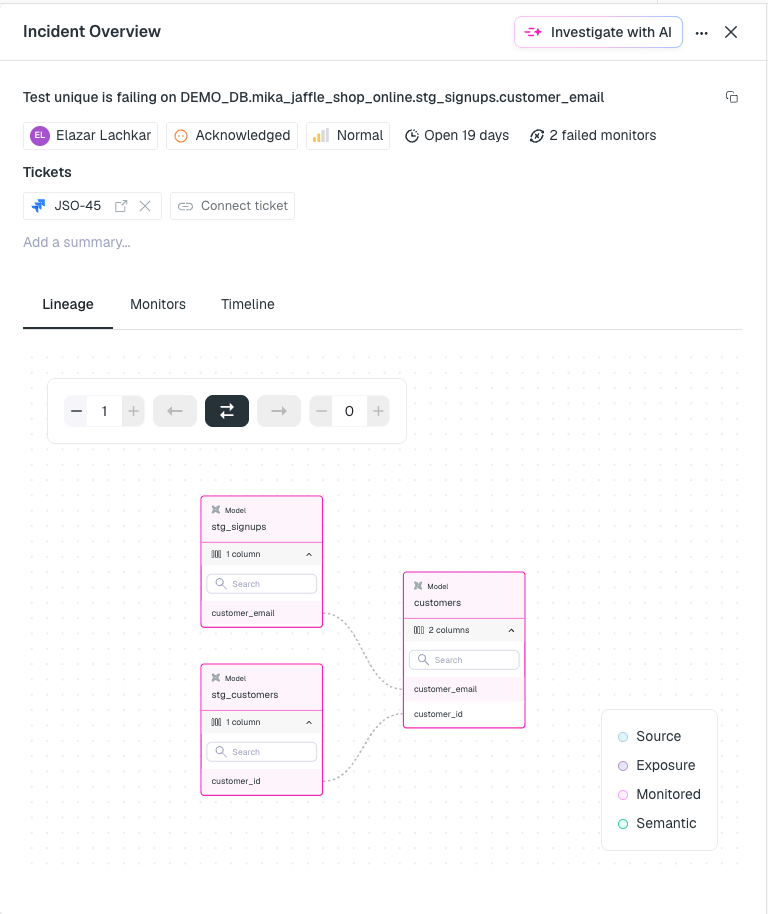
An interactive lineage graph showing the upstream and downstream assets related to all monitors in the incident. Use the hop controls to expand or collapse the graph.
The table columns include:
* **Severity** — editable inline via dropdown
* **Incident** — title, with a "Merged" chip for incidents containing multiple monitors
* **First Event** / **Last Event** — when the incident started and when the last failure occurred
* **Monitors** — status chips showing pass/fail/warning counts
* **Assignee** — editable inline, searchable dropdown
* **Status** — editable inline
Columns can be toggled on or off via the column menu. You can sort by severity, first event, last event, monitor count, or assignee.
## Filtering
The incidents page provides several ways to scope your view:
* **Search** — full-text search across incident titles
* **Filters** — severity, assignee, owner, database/schema/table, critical asset, and monitor count
* **Quick filters** — preset combinations for common views:
* **Unassigned** — incidents with no assignee
* **High priority** — unassigned incidents with High or Critical severity
* **Critical Assets** — incidents on assets marked as critical
* **Merged** — incidents with more than one monitor (result of a merge)
* **Days back** — adjust the time window (default: 3 days)
* **Tree selection** — select a folder, asset, or test in the left navigation tree to scope the list
## Incident detail
Clicking an incident row opens a detail drawer on the right side of the screen.
### Header
The top of the drawer shows the incident title, metadata chips (assignee, status, severity), duration, and the number of failing monitors. You can also:
* Edit the title
* Add or edit a summary
* Link or create tickets (Jira, Linear, ServiceNow, etc.)
### Tabs
An interactive lineage graph showing the upstream and downstream assets related to all monitors in the incident. Use the hop controls to expand or collapse the graph.
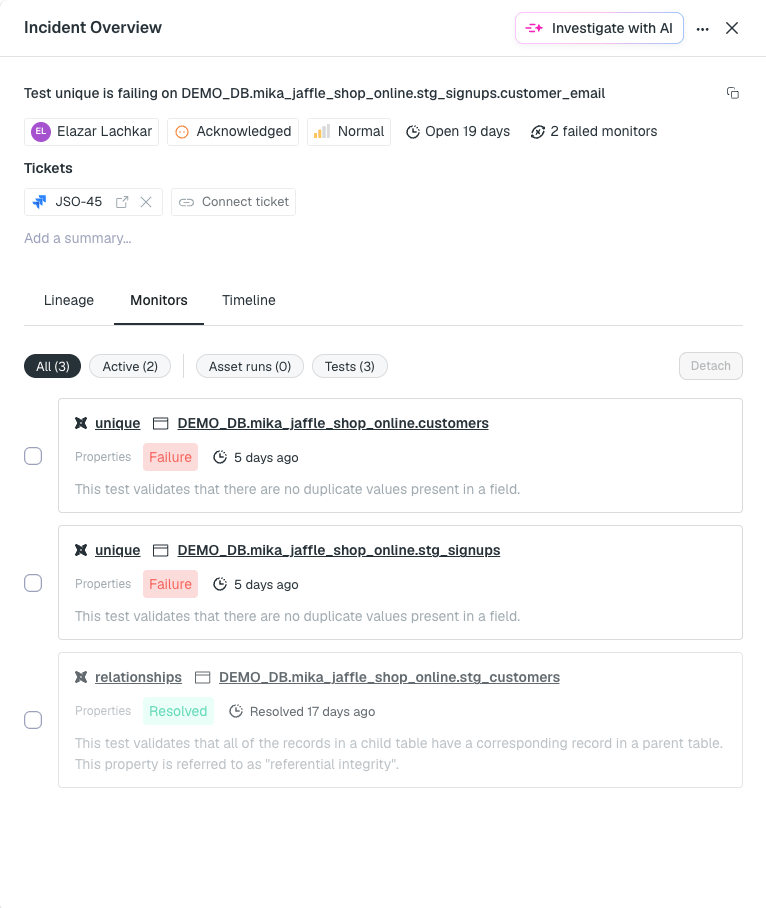
 A list of monitor cards — each showing the test name, asset, status, owners, and timestamps.
When an incident contains multiple monitors, you can select monitors and click **Detach** to [split them into separate incidents](/cloud/features/alerts-and-incidents/incident-merging#splitting-incidents-undo-a-merge).
A list of monitor cards — each showing the test name, asset, status, owners, and timestamps.
When an incident contains multiple monitors, you can select monitors and click **Detach** to [split them into separate incidents](/cloud/features/alerts-and-incidents/incident-merging#splitting-incidents-undo-a-merge).
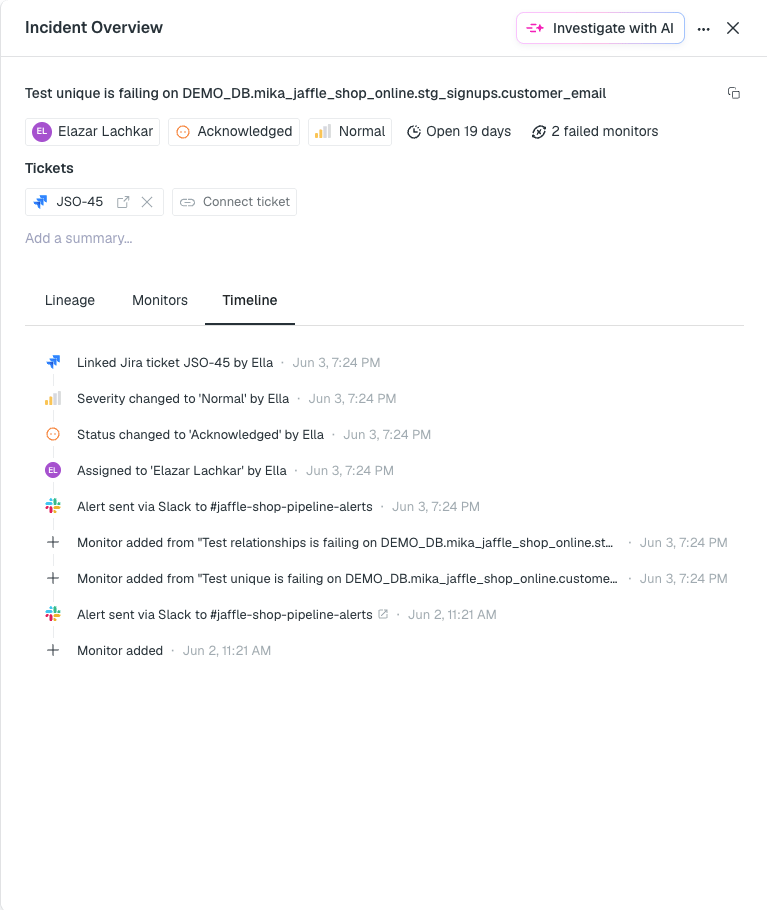
 A chronological feed of all events in the incident's history: status and severity changes, alerts sent (with destination links), monitors added or removed, tickets linked, and more.
 ## Bulk actions
Select multiple incidents using the checkboxes in the list to perform bulk operations via the floating action menu:
* Change **status**, **severity**, or **assignee** for all selected incidents at once
* **Merge** selected incidents into one — see [Incident merging](/cloud/features/alerts-and-incidents/incident-merging)
## Bulk actions
Select multiple incidents using the checkboxes in the list to perform bulk operations via the floating action menu:
* Change **status**, **severity**, or **assignee** for all selected incidents at once
* **Merge** selected incidents into one — see [Incident merging](/cloud/features/alerts-and-incidents/incident-merging)
 ## Ticketing
From the incident detail drawer, you can:
* **Create a ticket** in your connected ticketing tool (Jira, Linear, ServiceNow)
* **Attach an existing ticket** by ID or URL
* **Detach a ticket** from the incident
When a ticket is linked, its status is shown in the drawer. If `close_linked_ticket_on_incident_resolve` is enabled, resolving the incident will also close the linked ticket.
## Incident settings
Click the **gear icon** on the incidents page to access incident settings. Currently this includes [auto-merge rules](/cloud/features/alerts-and-incidents/incident-merging#auto-merge-rules) for automatically grouping related incidents.
## Ticketing
From the incident detail drawer, you can:
* **Create a ticket** in your connected ticketing tool (Jira, Linear, ServiceNow)
* **Attach an existing ticket** by ID or URL
* **Detach a ticket** from the incident
When a ticket is linked, its status is shown in the drawer. If `close_linked_ticket_on_incident_resolve` is enabled, resolving the incident will also close the linked ticket.
## Incident settings
Click the **gear icon** on the incidents page to access incident settings. Currently this includes [auto-merge rules](/cloud/features/alerts-and-incidents/incident-merging#auto-merge-rules) for automatically grouping related incidents.