> ## Documentation Index
> Fetch the complete documentation index at: https://docs.elementary-data.com/llms.txt
> Use this file to discover all available pages before exploring further.
# Cloud Tests
Cloud tests run in Elementary Cloud, outside your dbt pipeline. They don't require configuration in your dbt project — Elementary activates them automatically once your data warehouse is connected.
There are three Cloud tests:
| Test | What it detects |
| ----------------------------------------------------------------------------- | ------------------------------------------------------------------------------- |
| [Cloud freshness test](/cloud/features/anomaly-detection/automated-freshness) | Tables that haven't been updated within their expected window |
| [Cloud volume test](/cloud/features/anomaly-detection/automated-volume) | Unexpected drops or spikes in row count |
| [Data contract test](/cloud/features/data-tests/data-contract-test) | Schema mismatches against a defined contract — column names, types, nullability |
Cloud tests use warehouse metadata only — not the data itself — so they add no compute cost and run continuously without pipeline dependencies.
## Adding cloud tests
Cloud freshness and volume tests are activated automatically on all your sources. You can add additional tests from the UI or via the [Test Recommendation Agent](/cloud/ai-agents/test-recommendation-agent):
1. Navigate to the **Test Configuration** page, or select assets in the Catalog
2. Click **Add Test** and choose a **Table Test**
3. Select one or more tables to test
4. Filter on **Elementary Cloud** and choose your test — freshness, volume, or data contract
5. Configure the test parameters and add metadata if needed
6. Submit — no PR required
## Editing cloud tests
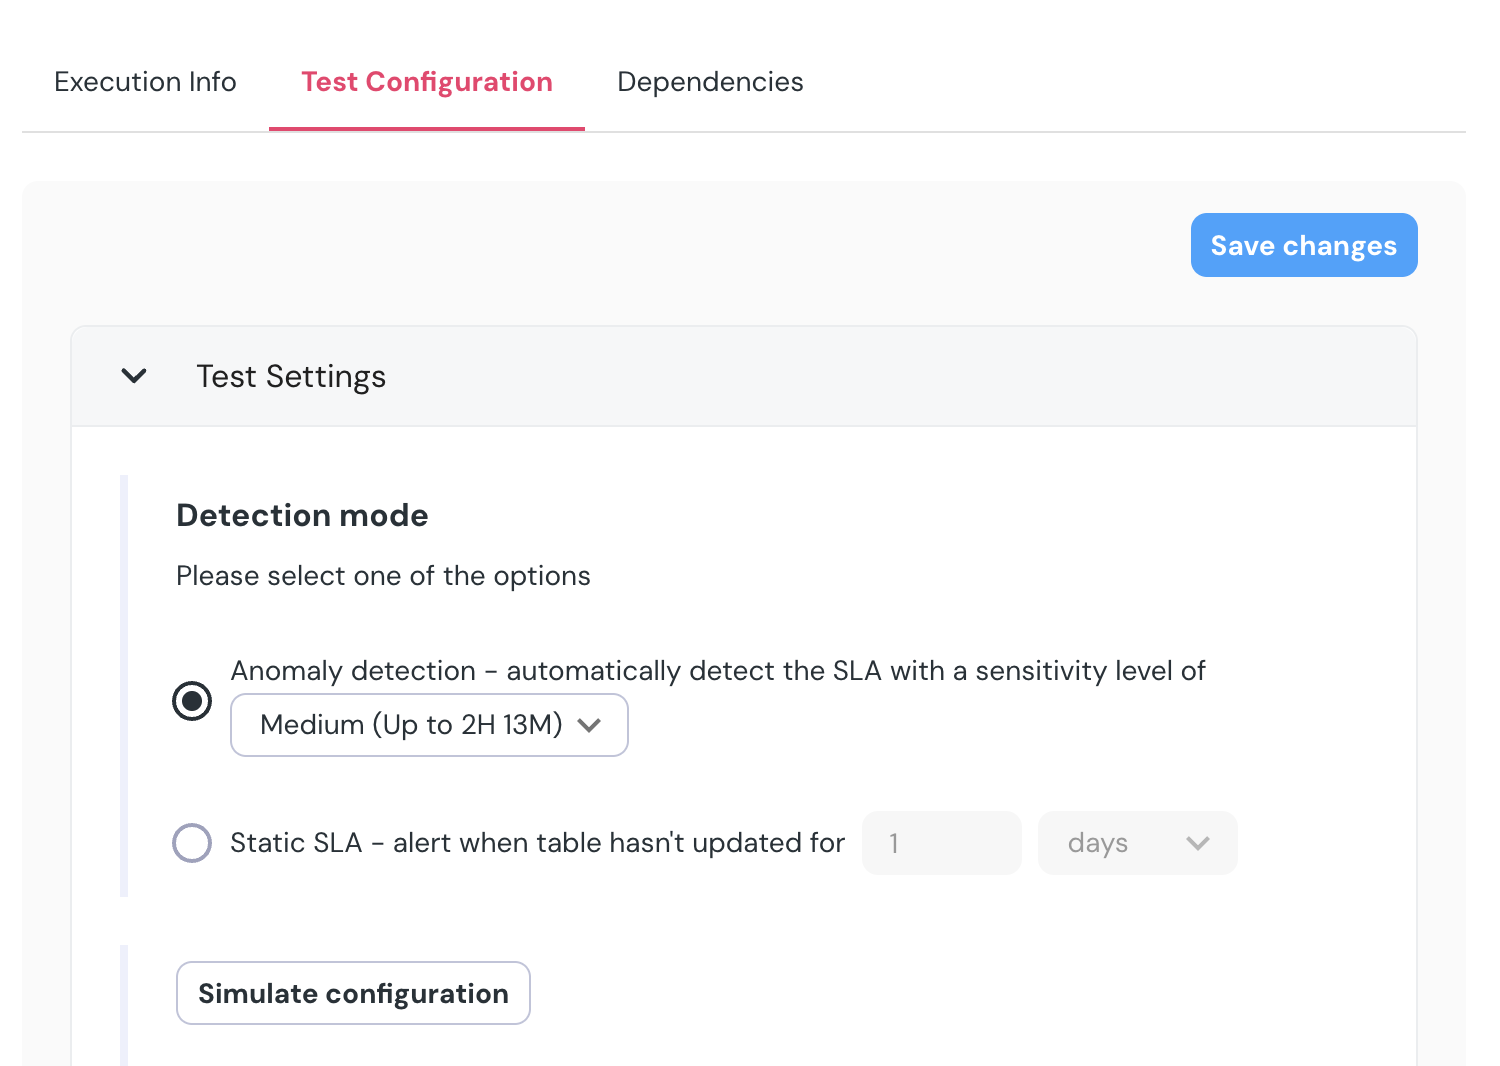
Open any test result and use **Anomaly settings** to tune the detection. For freshness and volume tests, you can:
* Adjust **sensitivity** (Low / Medium / High) to reduce noise or increase detection precision
* Switch between **automatic** (ML-based) and **manual** (SLA threshold) modes for freshness
* Change the **detection period** — the window in which the monitor looks for anomalies
* Set **anomaly direction** — fail on drops, spikes, or both
### Simulate configuration
After changing any setting, use **Simulate Configuration** to preview how the change would have affected recent results before saving.
### Exclude time ranges
Training periods sometimes include one-time anomalies — a manual script run, a known incident — that skew the model and cause `NO_DATA` results. You can exclude specific time ranges so the model learns from clean data only.
1. Click **Exclude** in the top-right of the chart, or go to the **Test Configurations** tab
2. Mark the section of the chart you want to exclude
3. Confirm — the excluded range appears under **Excluded time ranges** and can be edited or removed
After excluding, use **Simulate Configuration** to verify the impact.
## Removing cloud tests
* From the **Test Configuration** page: select one or more tests and use the delete option at the bottom
* From a test result: click `...` → **Delete test**
## Supported settings
#### All cloud tests
* **Severity** - Should a failure be considered a warning or a failure. Default is warning.
* **Test metadata** - Add metadata such as tags and owner to the test.
#### Volume test
* **Anomaly Direction** - Whether you want the monitor to fail on anomalous drops, spikes, or both. Default is both.
* **Sensitivity** - You can set the monitor's sensitivity levels to *Low*, *Medium*, or *High*. In the future, we plan to allow for more nuanced adjustments to this parameter. You can use the `Simulate Configuration` button for testing how the change will affect the monitor.
* **Detection Period** - The period in which the monitor look for anomalies. Default is the last 2 days.
#### Freshness test
You can choose between 2 detection methods for the Freshness monitor- Automatic and Manual.
* **Automatic** - Elementary uses machine learning models to detect anomalies in the data freshness. This is the default setting. You can change the sensitivity level to *Low*, *Medium*, or *High*.
For each level, you will see a simulation of the change impact on the latest result, and you can use the`Simulate Configuration` button to examine the change impact.
* **Manual** - You can set the SLA breach threshold for the freshness monitor manually. This is useful for assets that are updated regularly at the same time every day, hour or week.
 ## Result feedback
Use the **Result feedback** button on any test result to mark it as a true or false positive. Feedback improves the accuracy of the ML models over time.
For false positives, select a reason:
* **Insignificant change** — the anomaly isn't impactful enough to act on; consider relaxing sensitivity
* **Expected outlier** — the value should be within the expected range; triggers model retraining
* **Business anomaly** — expected due to an intentional change or event; excludes the result from training
* **Not an interesting table** — stop monitoring this table; deletes the monitor
* **Other** — add a comment to describe the case
## Metrics
Collect and monitor custom metrics using the [`elementary.collect_metrics`](/cloud/features/anomaly-detection/metrics) dbt test. Metrics are synced to Elementary Cloud and can have anomaly detection applied automatically.
For dbt tests and custom SQL tests, see the [dbt Package and Tests](/data-tests/introduction) tab.
## Result feedback
Use the **Result feedback** button on any test result to mark it as a true or false positive. Feedback improves the accuracy of the ML models over time.
For false positives, select a reason:
* **Insignificant change** — the anomaly isn't impactful enough to act on; consider relaxing sensitivity
* **Expected outlier** — the value should be within the expected range; triggers model retraining
* **Business anomaly** — expected due to an intentional change or event; excludes the result from training
* **Not an interesting table** — stop monitoring this table; deletes the monitor
* **Other** — add a comment to describe the case
## Metrics
Collect and monitor custom metrics using the [`elementary.collect_metrics`](/cloud/features/anomaly-detection/metrics) dbt test. Metrics are synced to Elementary Cloud and can have anomaly detection applied automatically.
For dbt tests and custom SQL tests, see the [dbt Package and Tests](/data-tests/introduction) tab.