> ## Documentation Index
> Fetch the complete documentation index at: https://docs.elementary-data.com/llms.txt
> Use this file to discover all available pages before exploring further.
# Table usage
Table usage shows how your data assets are **actually consumed** in the warehouse—how often they are queried and by who—based on **query activity** over a **rolling 30-day window**. That visibility helps you **prioritize incidents and data quality** on the assets that drive the most load and downstream impact, and get a **clearer end-to-end view** of what is happening in production.
## Usage in the Catalog
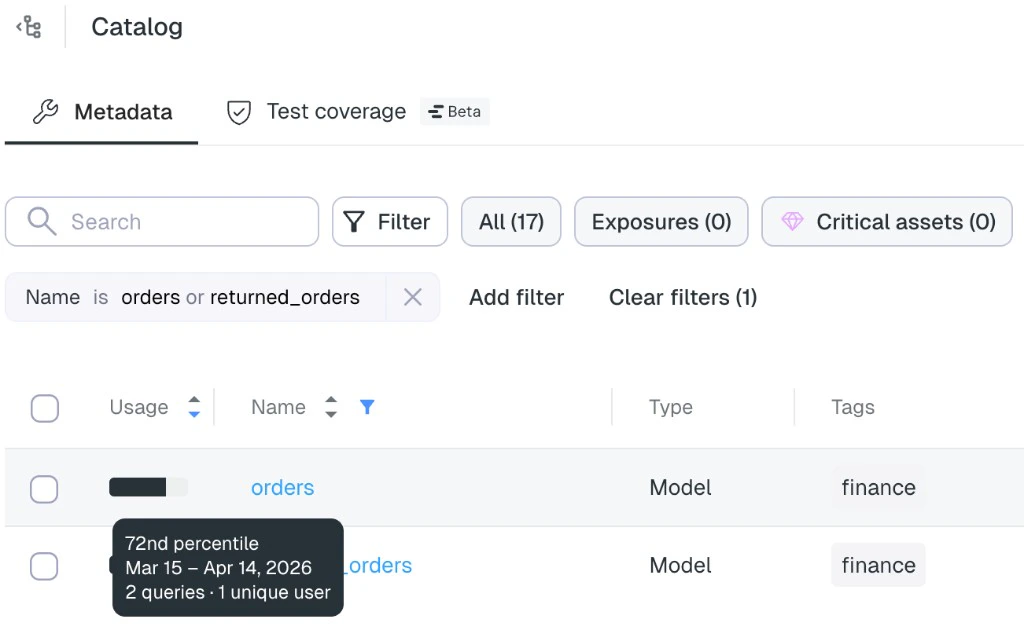
Open the **Catalog** and select the **Metadata** tab. Table assets include a **Usage** column with a **usage indicator** so you can compare relative activity at a glance.
 ### Tooltip details
Hover the usage indicator for a specific asset to open a tooltip with:
* **Percentile rank** — How this table’s query volume ranks against every other table. For example, **72nd percentile** means its query volume is **greater than or equal to** that of **72% of tables** in your environment.
* **Reporting period** — The exact **30-day** date range the metrics are based on (for example, March 15 – April 14, 2026).
* **Query count** — Total queries against the table in that period.
* **Unique users** — Distinct users who ran queries against the table in that period.
## AI agents
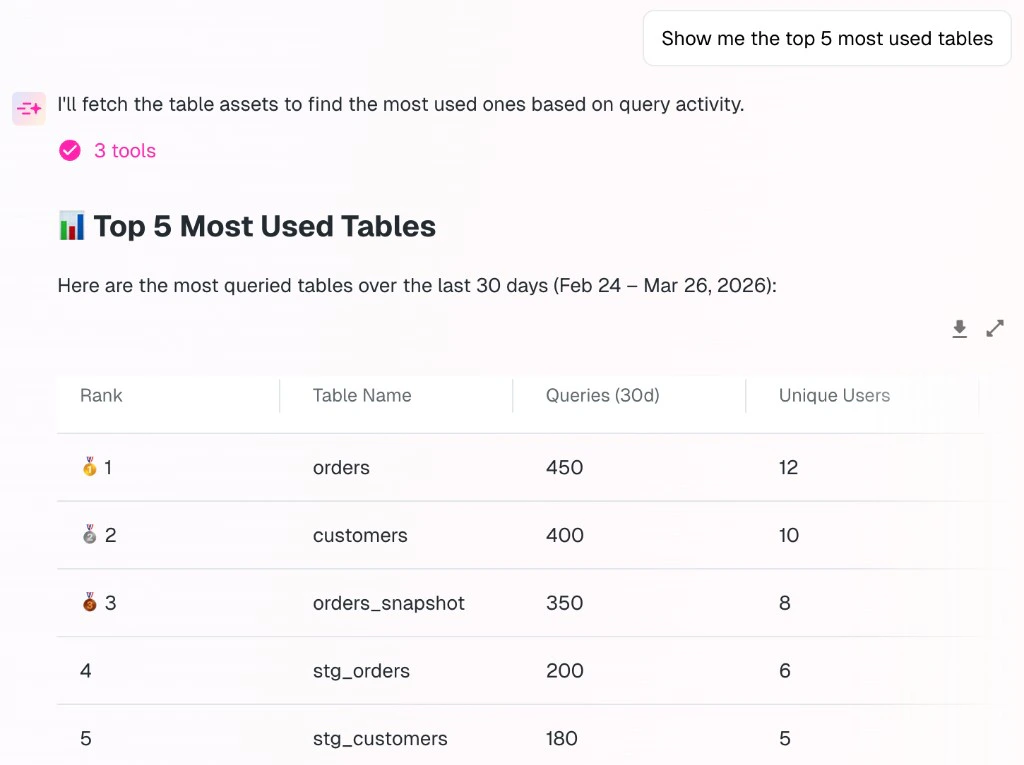
The same usage signals are available as **context** to Elementary **AI agents**, so you can ask natural-language questions that depend on real consumption—for example, **“Show me the top 5 most used tables.”**
### Tooltip details
Hover the usage indicator for a specific asset to open a tooltip with:
* **Percentile rank** — How this table’s query volume ranks against every other table. For example, **72nd percentile** means its query volume is **greater than or equal to** that of **72% of tables** in your environment.
* **Reporting period** — The exact **30-day** date range the metrics are based on (for example, March 15 – April 14, 2026).
* **Query count** — Total queries against the table in that period.
* **Unique users** — Distinct users who ran queries against the table in that period.
## AI agents
The same usage signals are available as **context** to Elementary **AI agents**, so you can ask natural-language questions that depend on real consumption—for example, **“Show me the top 5 most used tables.”**
 ## Related
* [Data Catalog](/cloud/features/collaboration-and-communication/catalog) — Overview of catalog navigation, metadata editing, and collaboration workflows.
* [AI agents](/cloud/ai-agents/overview) — How Elementary’s agents use catalog and observability context.
## Related
* [Data Catalog](/cloud/features/collaboration-and-communication/catalog) — Overview of catalog navigation, metadata editing, and collaboration workflows.
* [AI agents](/cloud/ai-agents/overview) — How Elementary’s agents use catalog and observability context.