How incidents work
Based on grouping rules, related failures are grouped into the same incident rather than creating separate noise. Grouping rules:- Additional failures of the same test or monitor on a table that already has an active incident.
- Coming soon — Freshness and volume issues downstream of an open model failure.
- Coming soon — Failures of the same test or monitor on downstream tables of an active incident.
Resolved.
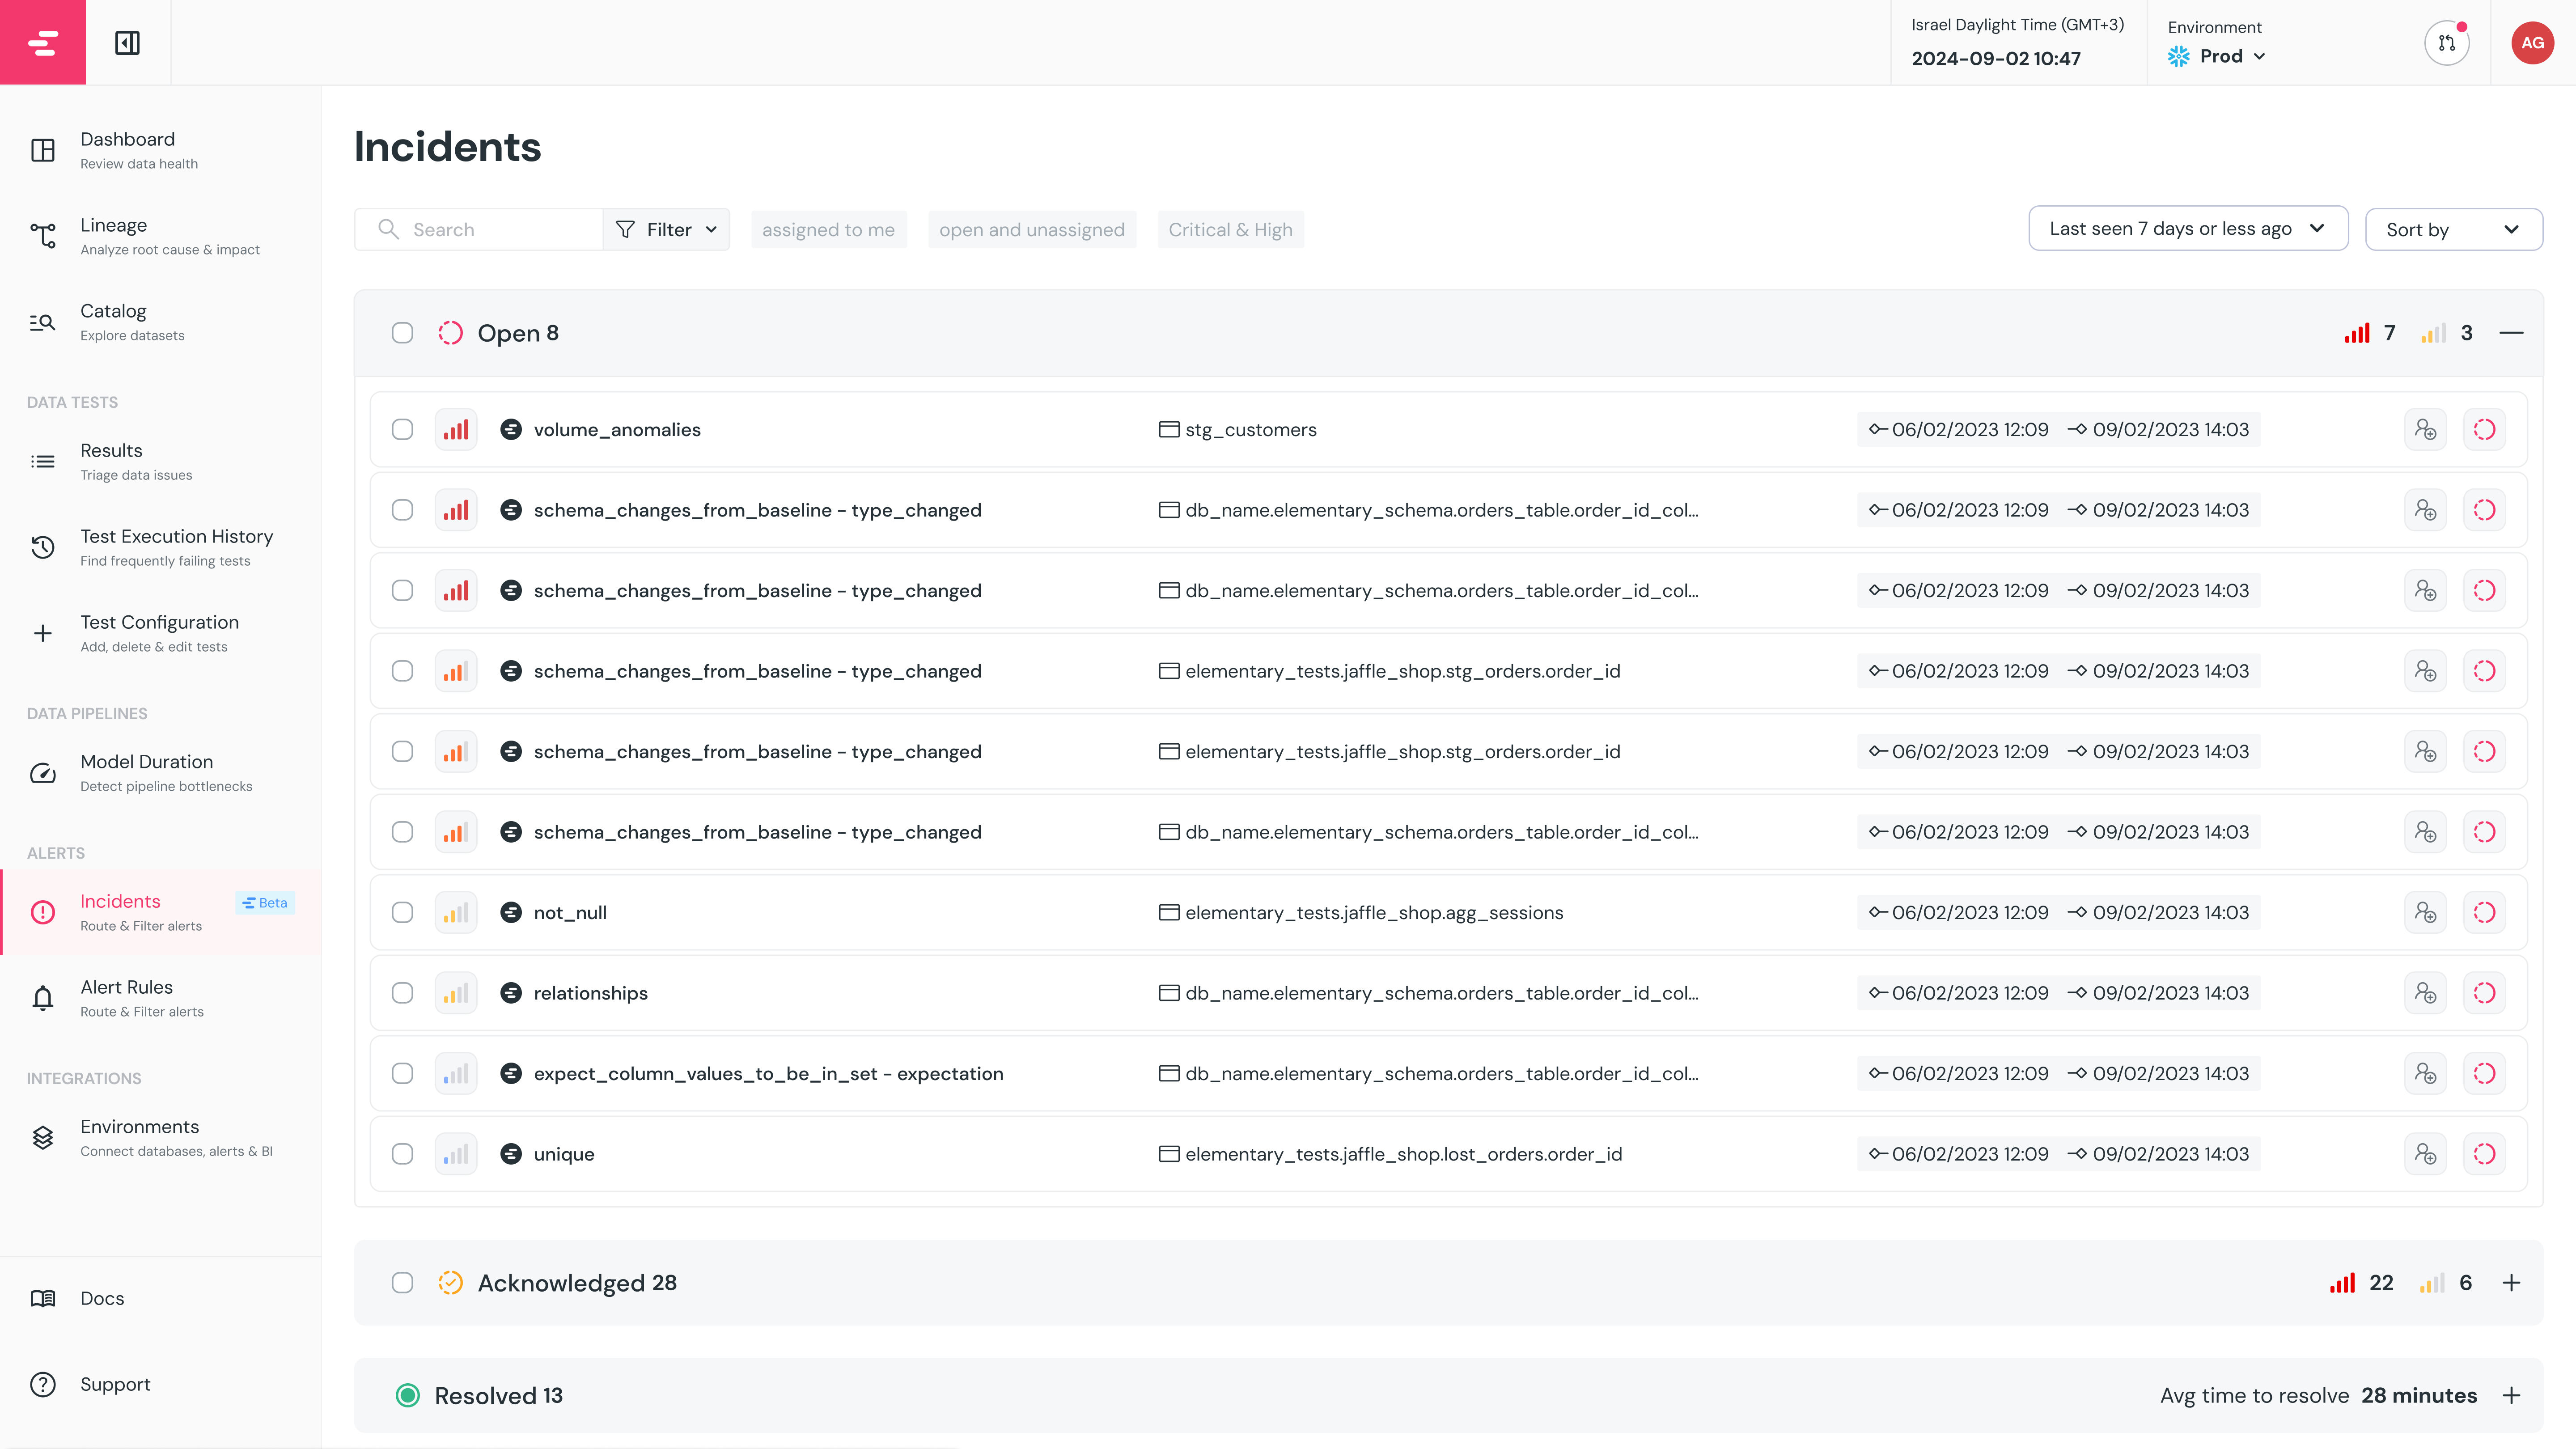
Managing incidents
The Incidents page gives a full view of current and past incidents, with filters to slice by status, severity, model name, assignee, and timeframe.
Each incident has a status, assignee, and severity — set from the Incidents page or directly from an alert in integrations that support alert actions.
- Status —
Openby default. Can be changed toAcknowledged. Setting toResolvedcloses the incident permanently. - Assignee — Assign to any team member. They’ll be notified. Leave status as
Openuntil they acknowledge. - Severity — Low, Normal, High, or Critical. Model errors default to Critical, test failures to High, warnings to Normal. Can be changed manually.
Incident severity is used to prioritize response — it is not the same as dbt test severity.
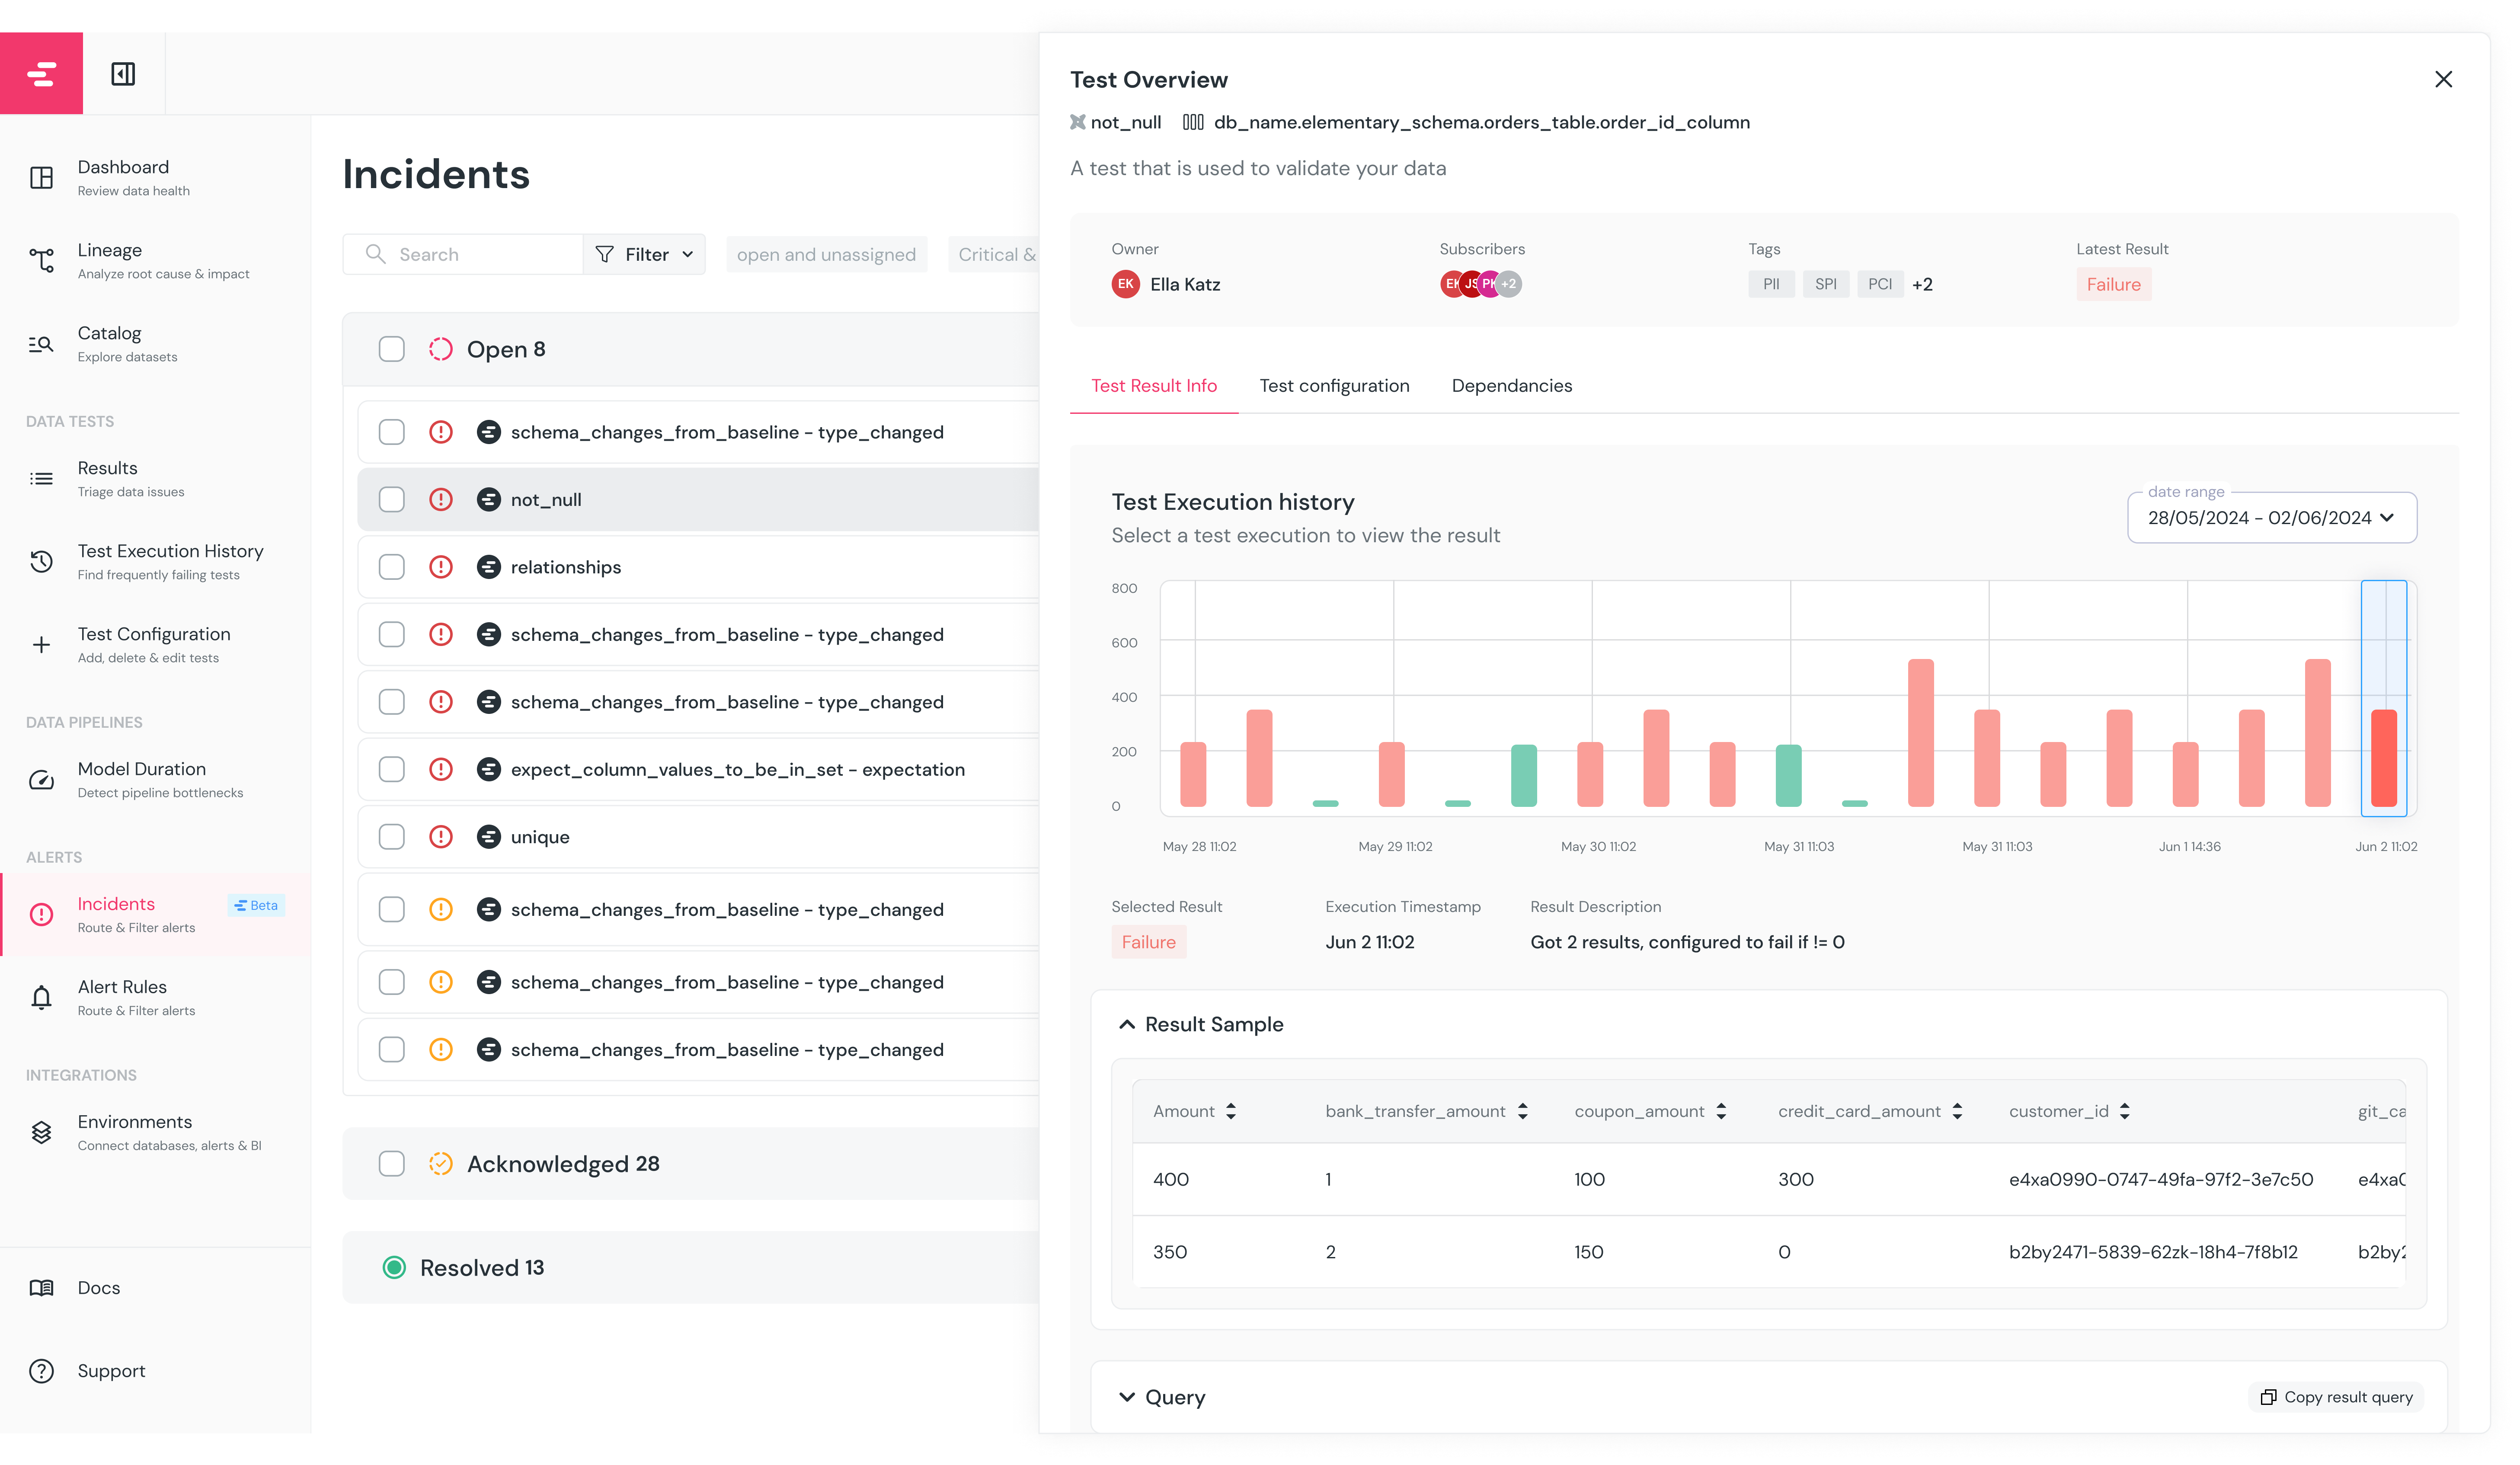
Incident deep dive
Clicking an incident opens the test overview side panel with:- Owner, tags, and subscribers for the test or model
- Execution history — result, timing, failed row samples, alert destination, and anomaly chart per run
- Test or model configuration — the YAML or SQL. For Cloud tests, configuration is editable directly.
- Upstream and downstream lineage — columns for column tests, tables for table tests