- Test Coverage screen — a visual overview of coverage across all your assets and dimensions, with the ability to add missing tests directly from the UI
- Test Recommendation Agent — analyzes your pipeline, lineage, and existing tests to suggest what’s missing and where, then adds tests on your behalf
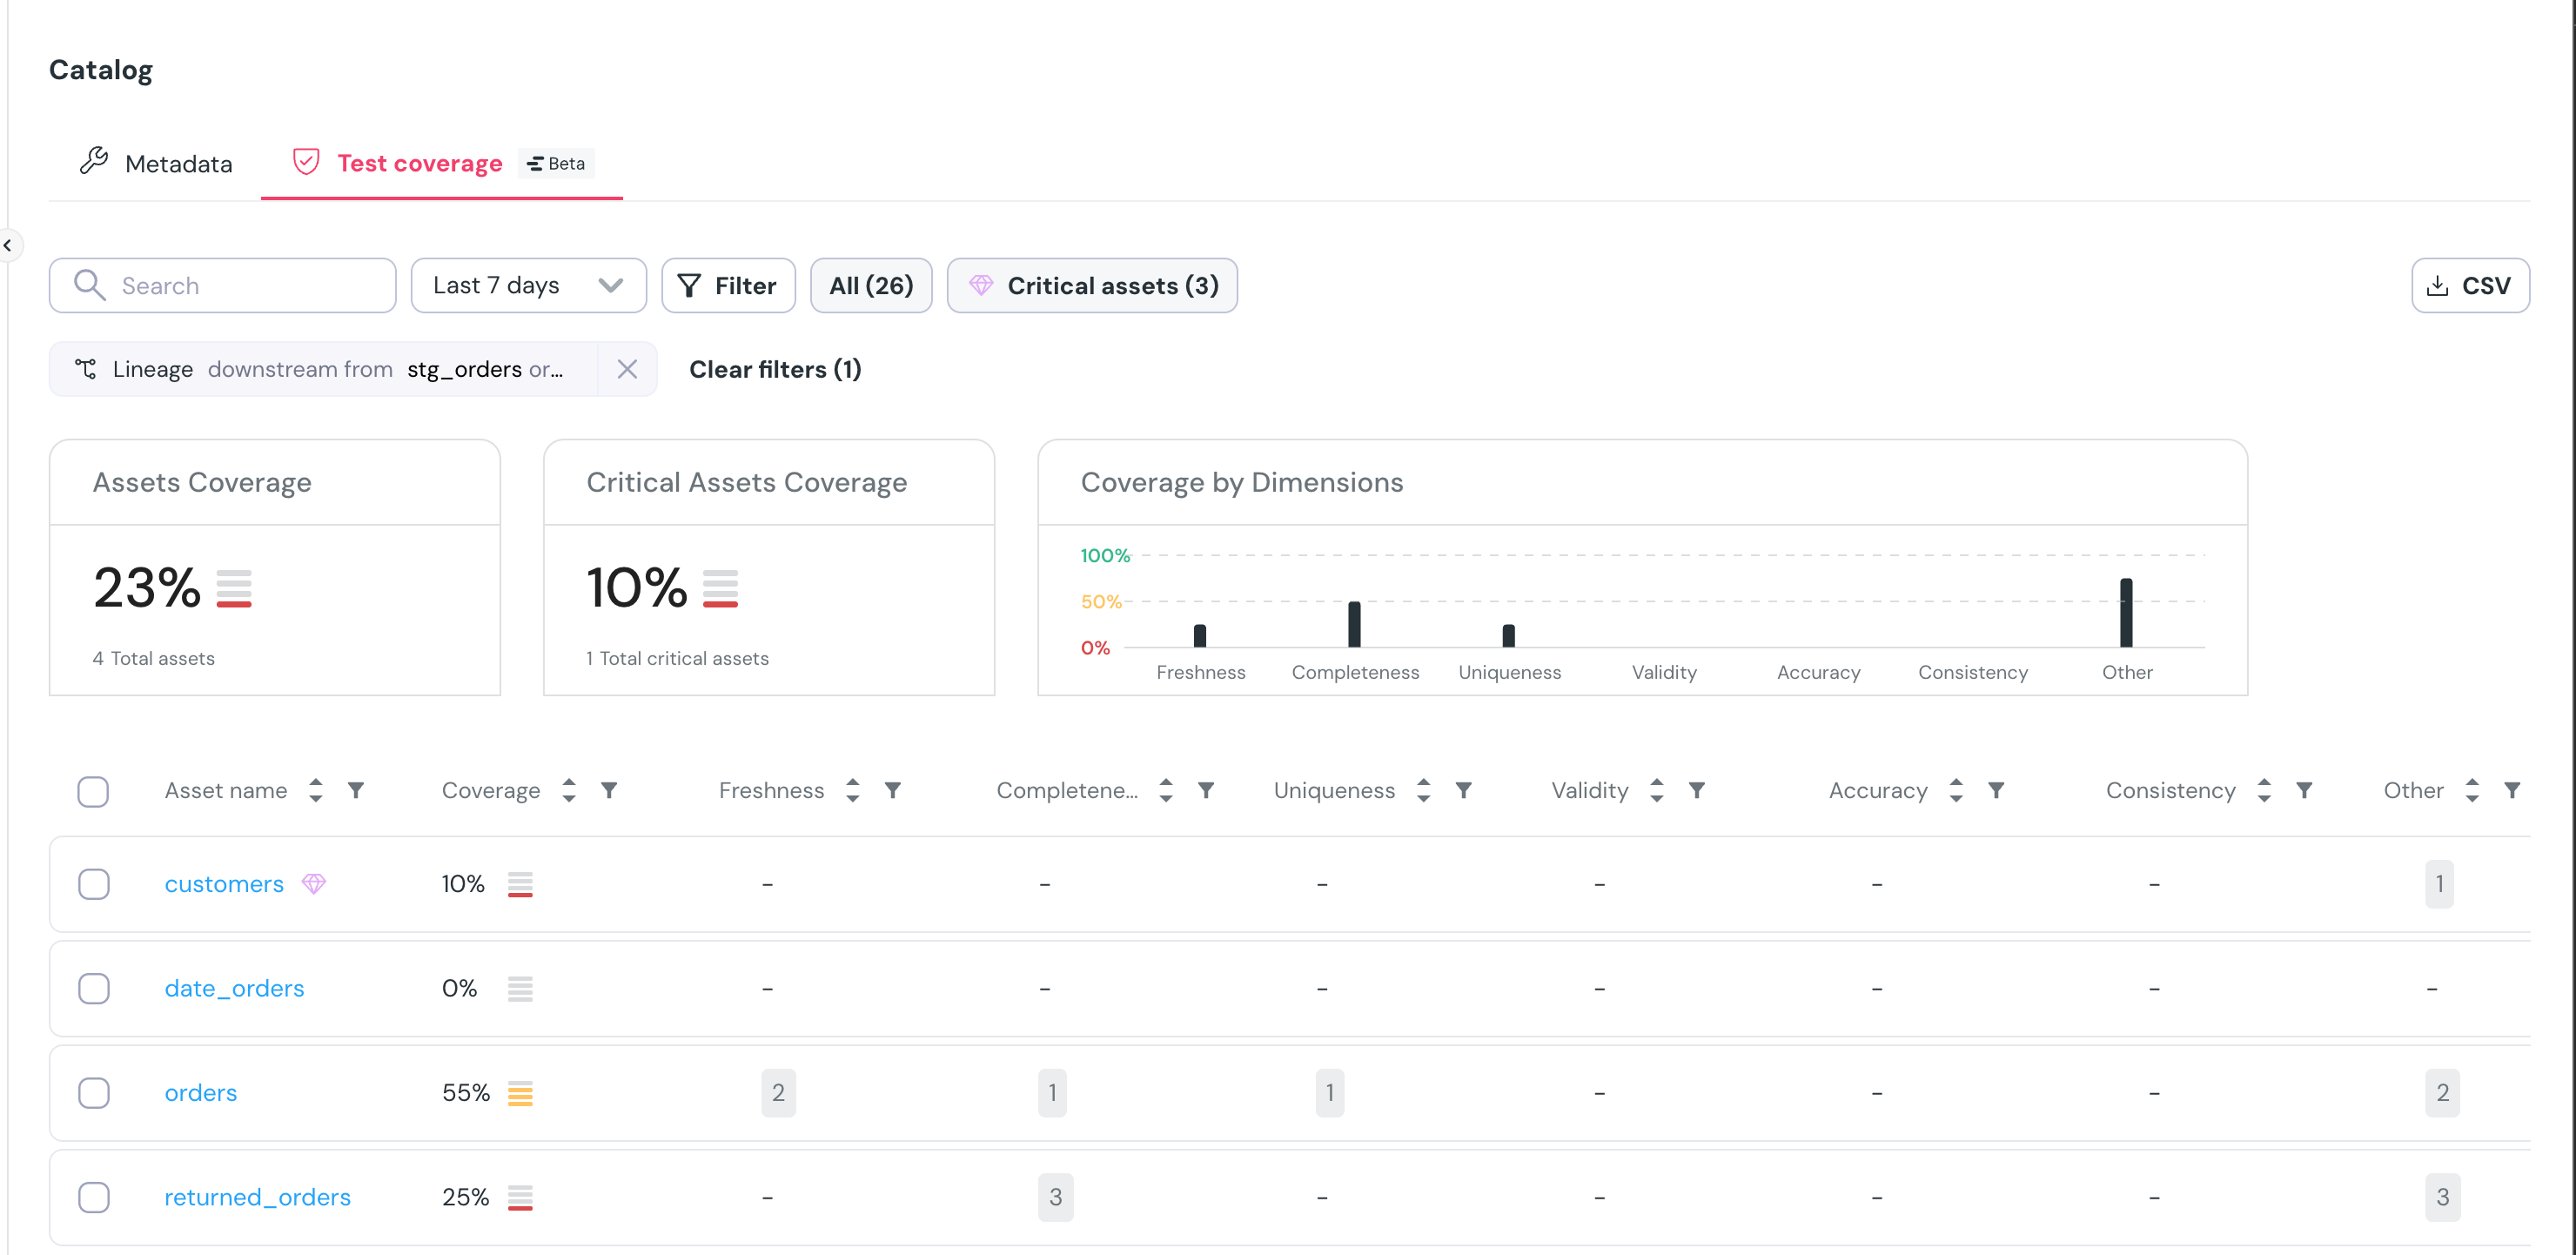
What It Shows
Each asset is evaluated across seven data quality dimensions:- Freshness
- Completeness
- Uniqueness
- Validity
- Accuracy
- Consistency
- Other
- Which dimensions are covered by existing tests
- Where coverage is missing
- A coverage score between 0–100%.
- Links to test results
What You Can Do from This Screen
From the Test Coverage screen, you can:- Filters by asset properties, test name, critical assets, and coverage ranges.
- Select multiple assets and seamlessly add your missing tests with just a few clicks
- Jump directly to any asset in the catalog to review its details
- Gain insight into gaps by grouping assets across dimensions like domain, pipeline, tag, or owner—making weak spots easy to identify. (Coming soon)
- Export the results to CSV
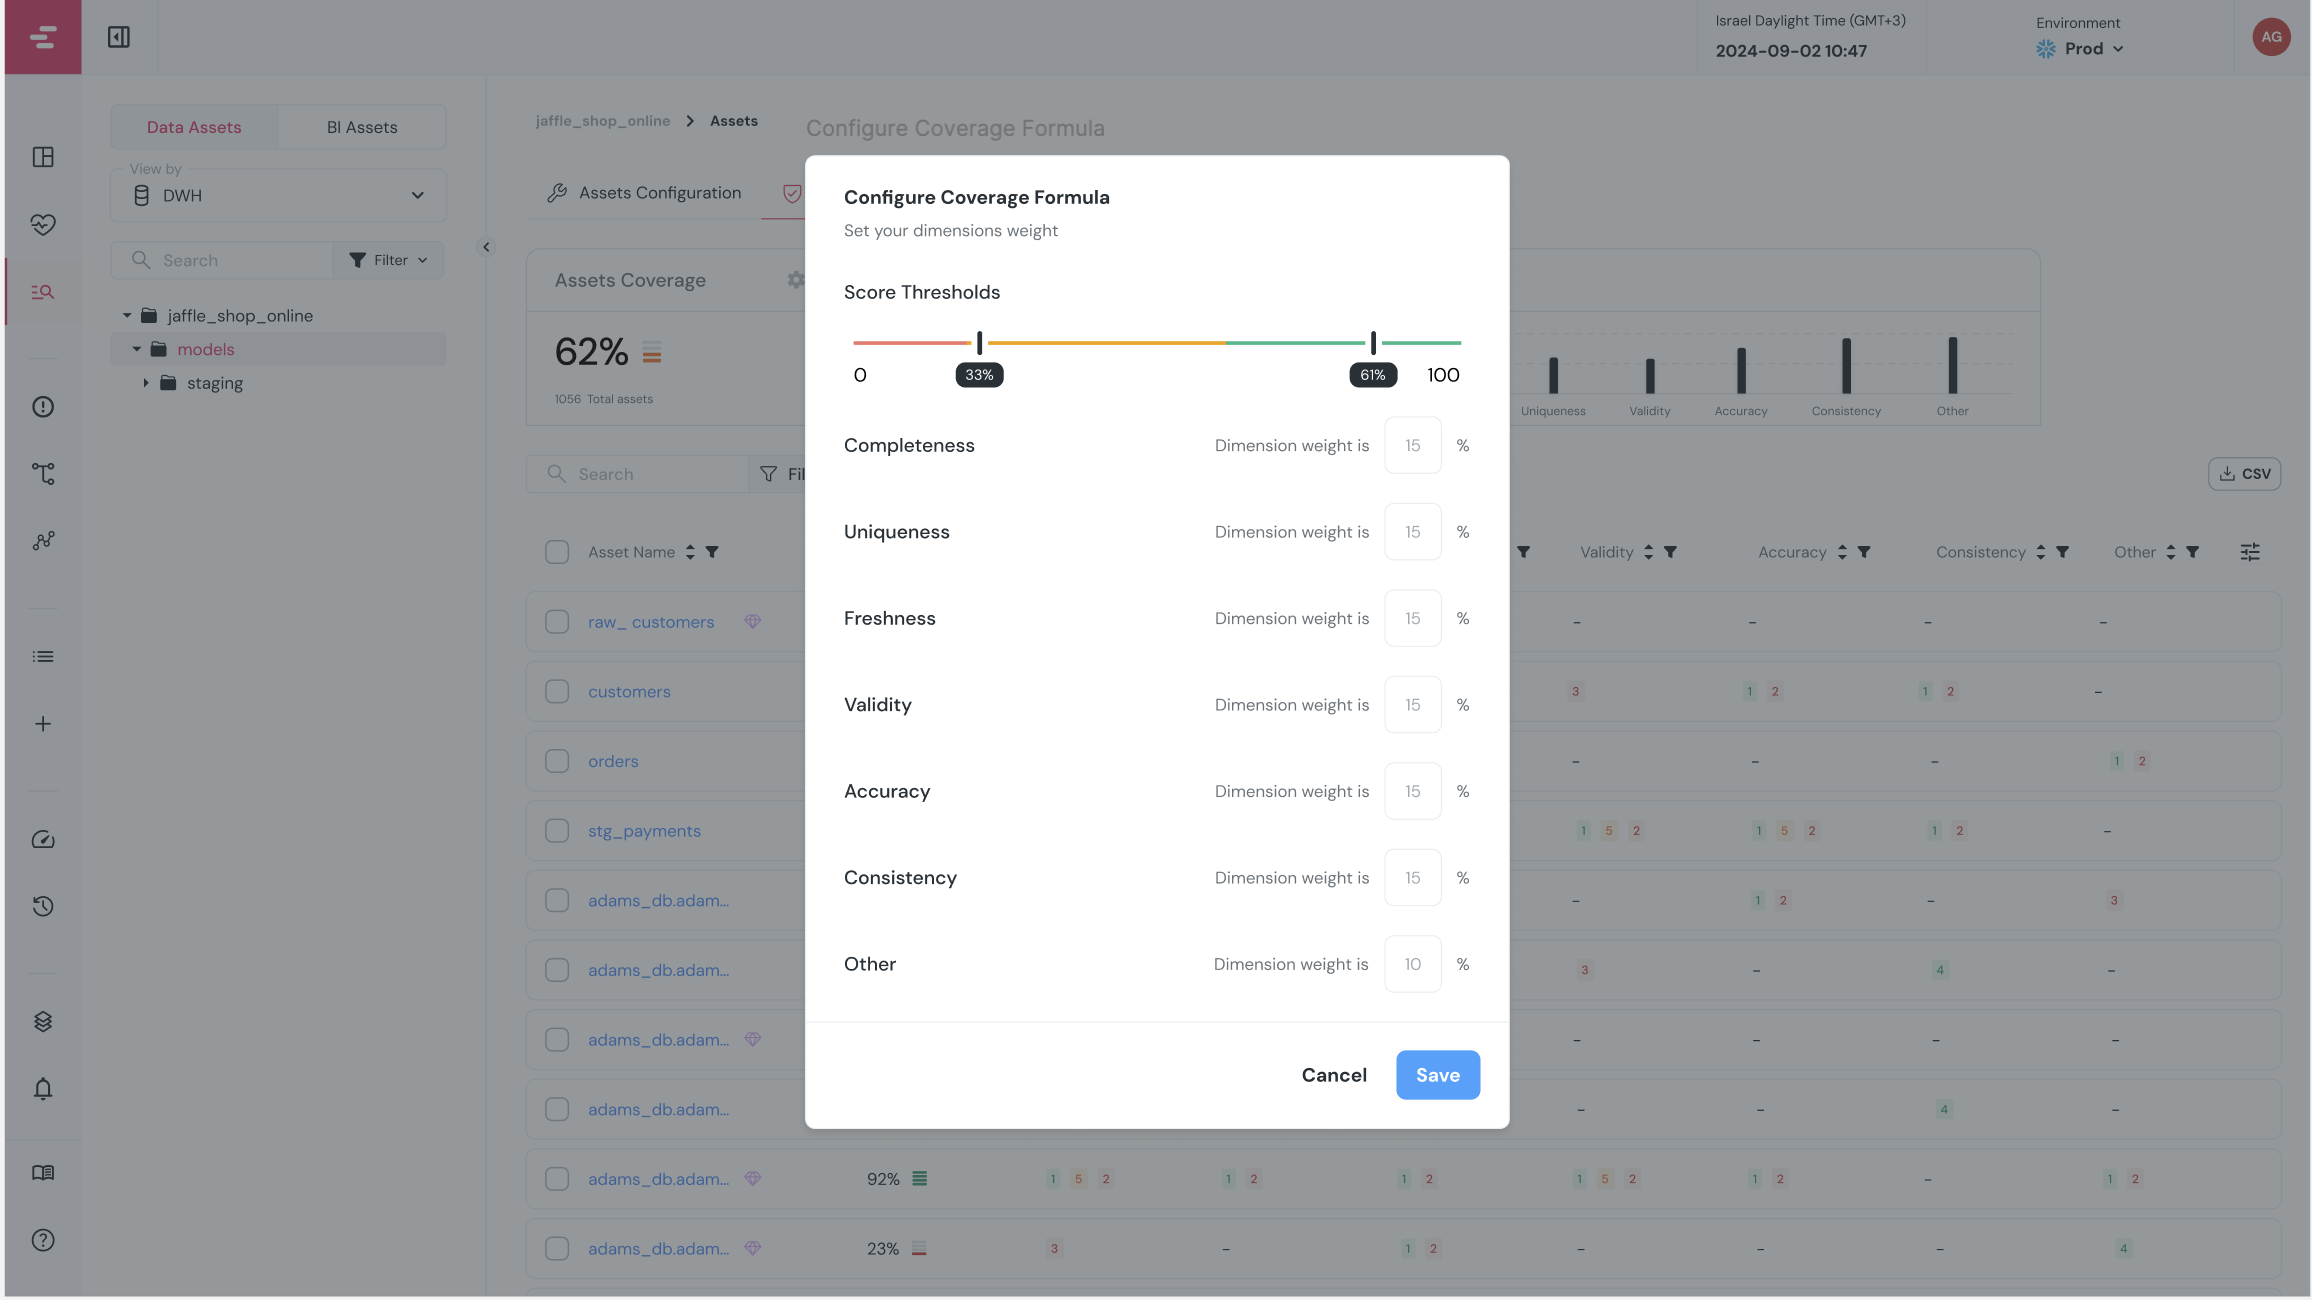
How Coverage Calculation Works
The test coverage score is calculated based on 7 dimensions of data quality. The first 6 core dimensions each contribute 15% to the total score. The 7th dimension, labeled “Other,” accounts for the remaining 10% and is primarily used for business logic tests that don’t align directly with any specific core dimension.Upcoming Features
- Customizable Weights: You’ll soon be able to tailor the weighting of each dimension to align with your organization’s unique priorities and testing standards.
- Custom Coverage Rules: Define your own coverage criteria to better identify tables that do not meet your internal standards. This will make it easier to spot gaps and maintain consistent data quality practices.