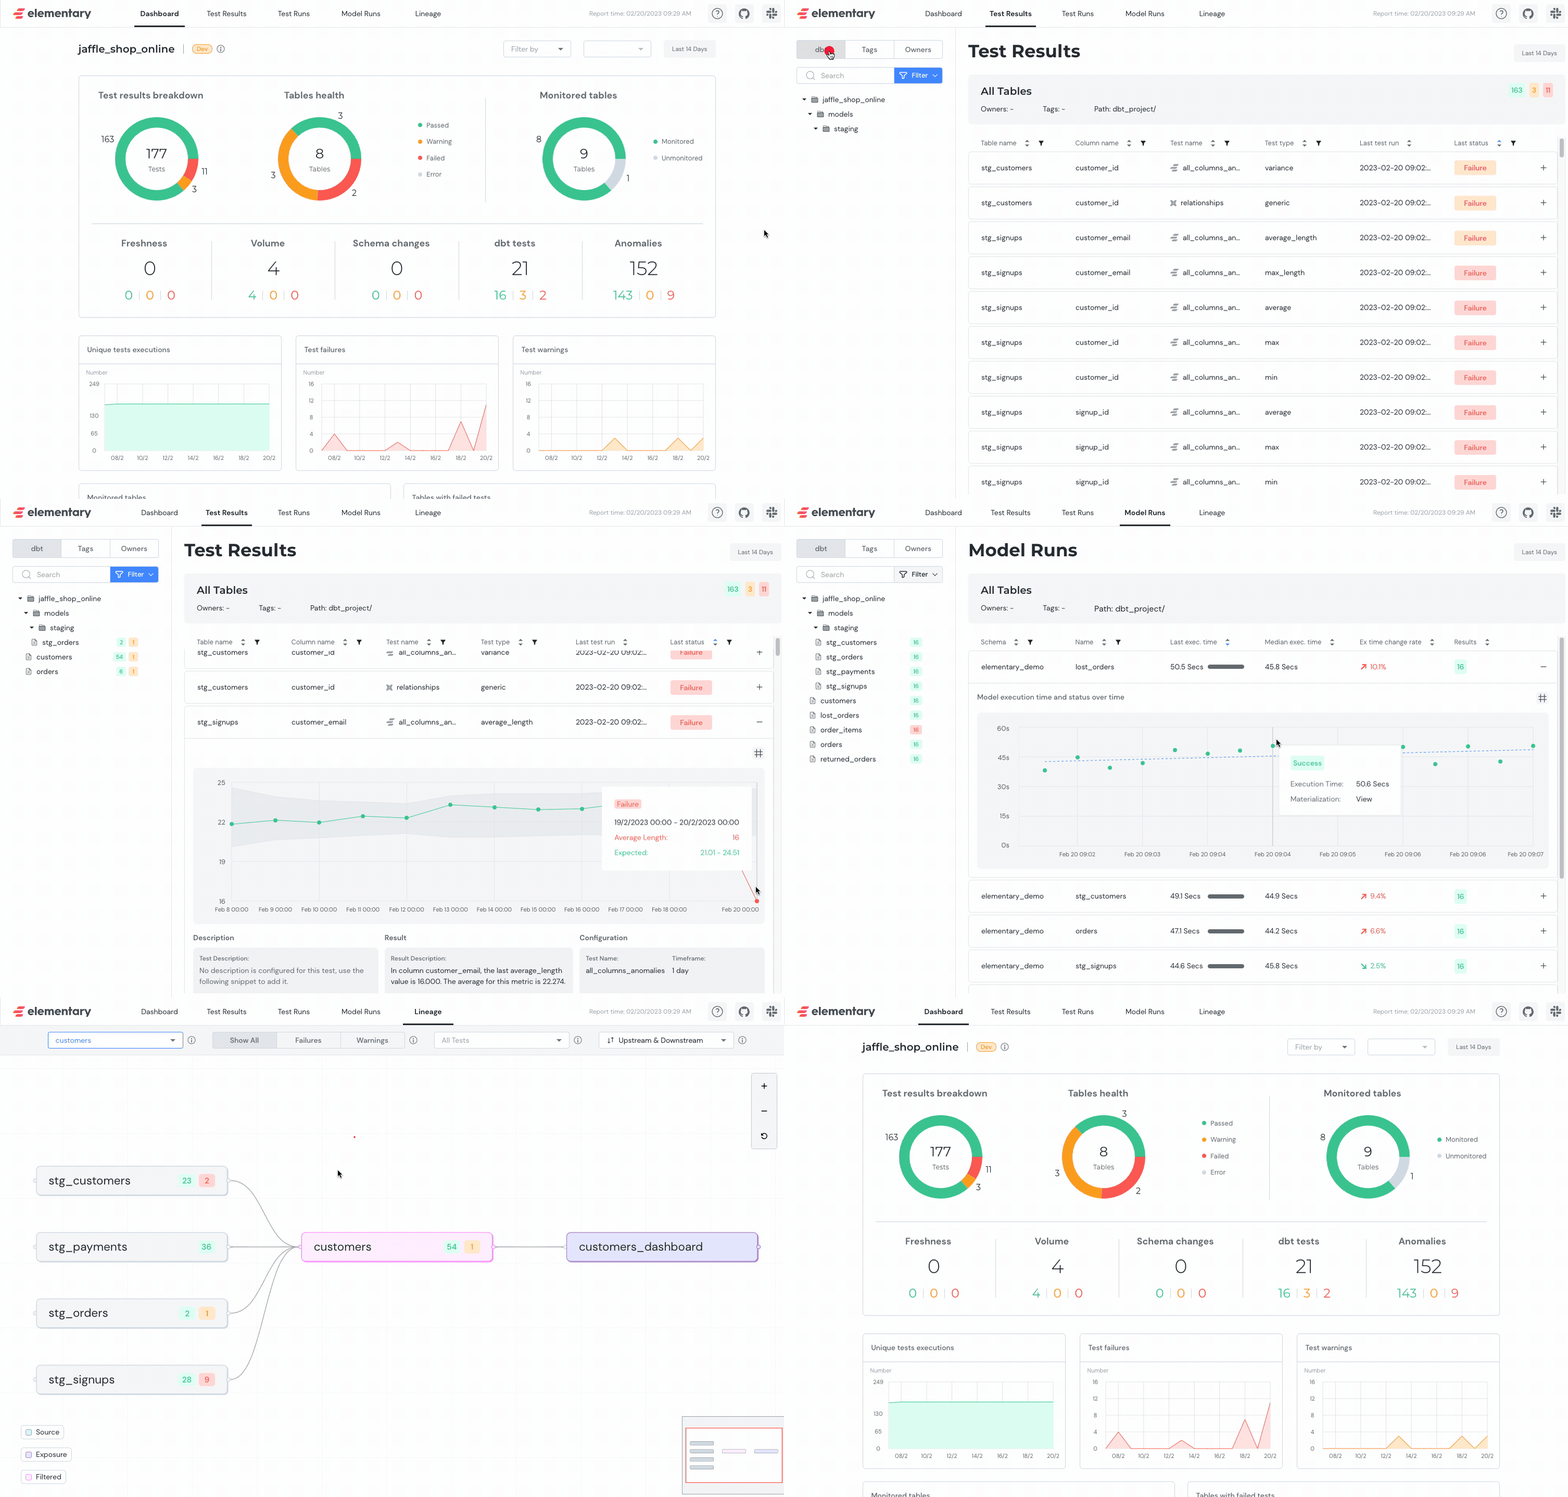
Elementary data observability report can be used for visualization and exploration of data from the dbt-package tables. That includes dbt test results, Elementary anomaly detection results, dbt artifacts, tests runs, etc.Documentation Index
Fetch the complete documentation index at: https://docs.elementary-data.com/llms.txt
Use this file to discover all available pages before exploring further.

Before you start
Before you can start using the report, make sure to install the dbt package, configure a profile and install the CLI. This is required for the report to work.dbt package installation
dbt package installation
How to install Elementary dbt package?
Configure connection profile
Configure connection profile
Configuring the Elementary Profile
In order to connect, Elementary needs a connection profile in a file namedprofiles.yml.
This profile will be used by the CLI, to connect to the DWH and find the dbt package tables.The easiest way to generate the profile is to run the following command within the dbt project where you deployed the elementary dbt package (works in dbt cloud as well):profiles.yml.
Here is a demonstration:Elementary profile details and format
- Path:
HOME_DIR/.dbt/profiles.yml - Profile name:
elementary - Schema name: The schema of elementary models, default is
<your_dbt_project_schema>_elementary
Install CLI
Install CLI
Install Elementary CLI
To install the monitor module run:edr --help in order to ensure the installation was successful.If you’re receiving command not found: edr please check our troubleshooting guide.Generate Tests Report UI
Execute edr report in your terminal
After installing and configuring the CLI, execute the command:
Generating a report for single invocation
Elementary support filtering the report by invocation on generation. The filtered report will only include data for the selected invocation (This applies only on theTest Results and Lineage screens).
There are 3 ways to filter the report by invocation:
- Last invocation - Filter by the last invocation (
dbt test/dbt build) that ran. - Invocation time - Filter by the closest invocation (
dbt test/dbt build) to the provided time (the provided time should be in ISO format local time). - Invocation id - Filter by the provided invocation (
dbt test/dbt build) id.
edr report invocation filters
Sharing the report
Elementary offers 3 methods that make it easy to share the report with others:- Send via Slack
- Host on Amazon S3
- Host on Google Cloud Storage (GCS)

