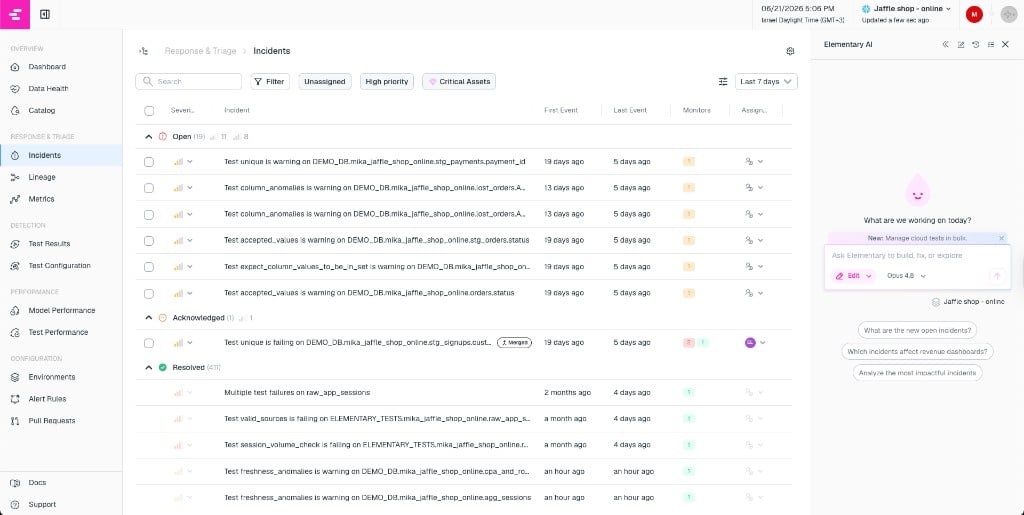
Incidents list grouped by Open, Acknowledged, and Resolved
How incidents are created
When a test or monitor fails, Elementary automatically opens a new incident for it. If auto-merge rules are enabled, related failures may be grouped into a single incident automatically instead of creating separate ones. Incidents can also be merged manually or by the AI agent after they are created.Incident properties
Each incident has the following properties:- Title — auto-generated from the failing monitor. Can be edited manually.
- Status —
Openby default. Can be changed toAcknowledged, then toResolved. Resolving an incident closes it permanently. - Severity — Low, Normal, High, or Critical. Model errors default to Critical, test failures to High, warnings to Normal.
- Assignee — assign to any team member. They will be notified.
- Summary — free-text field to capture context or notes about the incident.
- Tickets — link to Jira or other ticketing integrations for tracking.
Incident severity is used to prioritize response — it is not the same as dbt test severity.
How incidents are resolved
An incident is resolved in one of two ways:- Automatically — when all monitors in the incident pass again, Elementary resolves the incident.
- Manually — a user sets the status to
Resolvedfrom the incidents page or from a Slack alert action.
Incident detail
Clicking an incident opens a detail drawer with three tabs:- Lineage — interactive upstream and downstream lineage graph for all assets in the incident.
- Monitors — cards for each monitor in the incident, showing test name, asset, status, and owners. From here you can split monitors into separate incidents if needed.
- Timeline — chronological history of all events: status changes, alerts sent, monitors added or removed, tickets linked, and more.