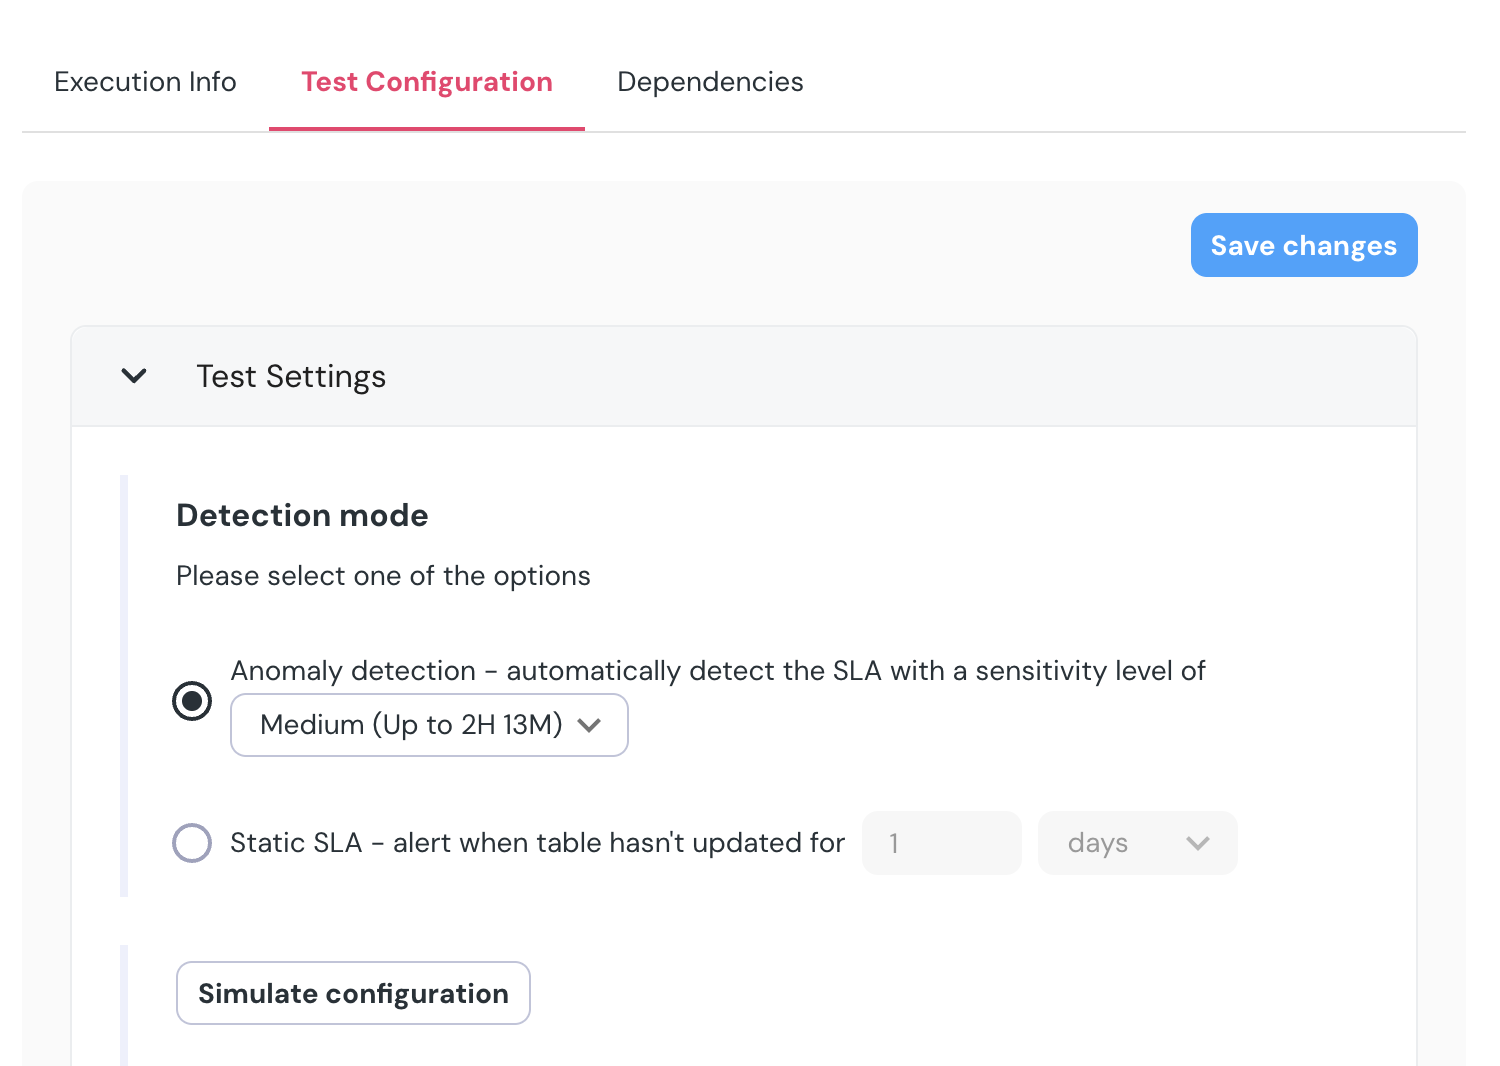
Anomaly detection based
The default operation mode of the freshness monitors. It learns the update frequency of your tables and consistently checks if the table is currently fresh based on our model’s forecast. By default we use 21 days of training data to understand the intervals between table updates. The only condition that determines the status of the monitor is the time that has passed since the last update, which is compared to the model’s prediction. The model takes into account seasonality, and supports cases such as tables that update on weekdays and not weekends.SLA based
Sometimes you might want to monitor a table based on a fixed SLA, in order to have full control over when the monitor will alert. This mode is based on a fixed SLA that you define for each table. The monitor will alert if the table hasn’t been updated in the defined SLA period.Understand the monitor result
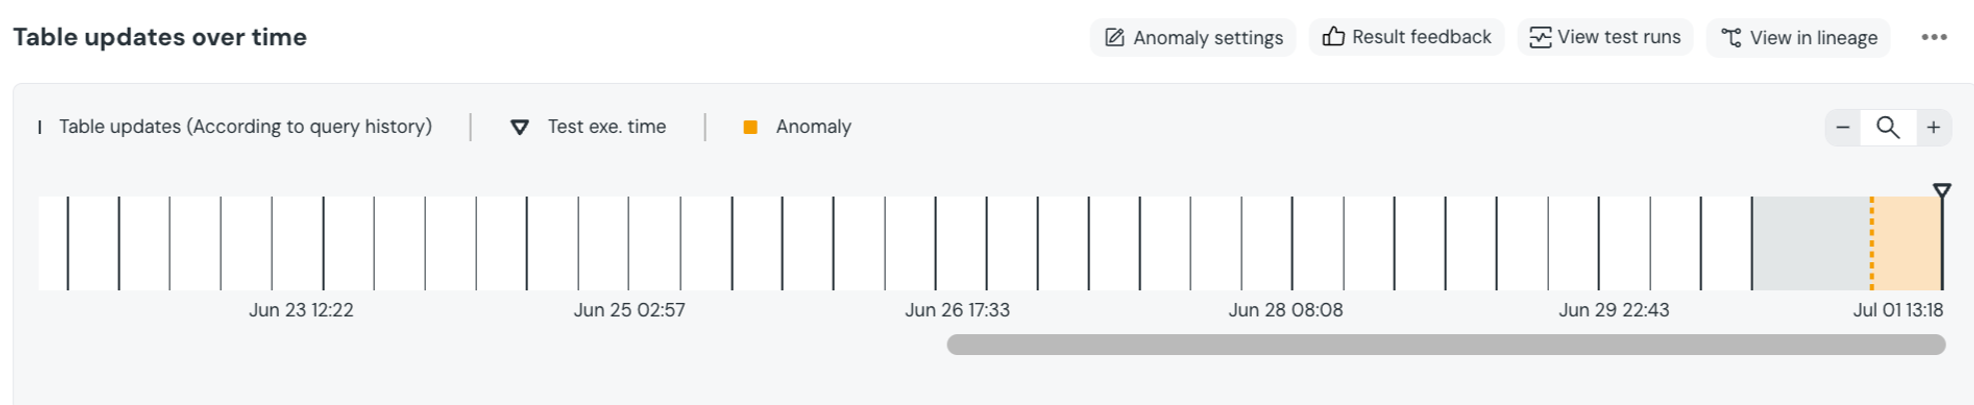
- Green - The gap between latest update and now is still within the expected range.
- Yellow / Red - The gap between latest update and now is above the expected range, a dotted line will show what was the expected gap limit. The color represents if this is a warning or failure.
Anomaly settings and result feedback buttons to impact the monitor.
Anomaly settings
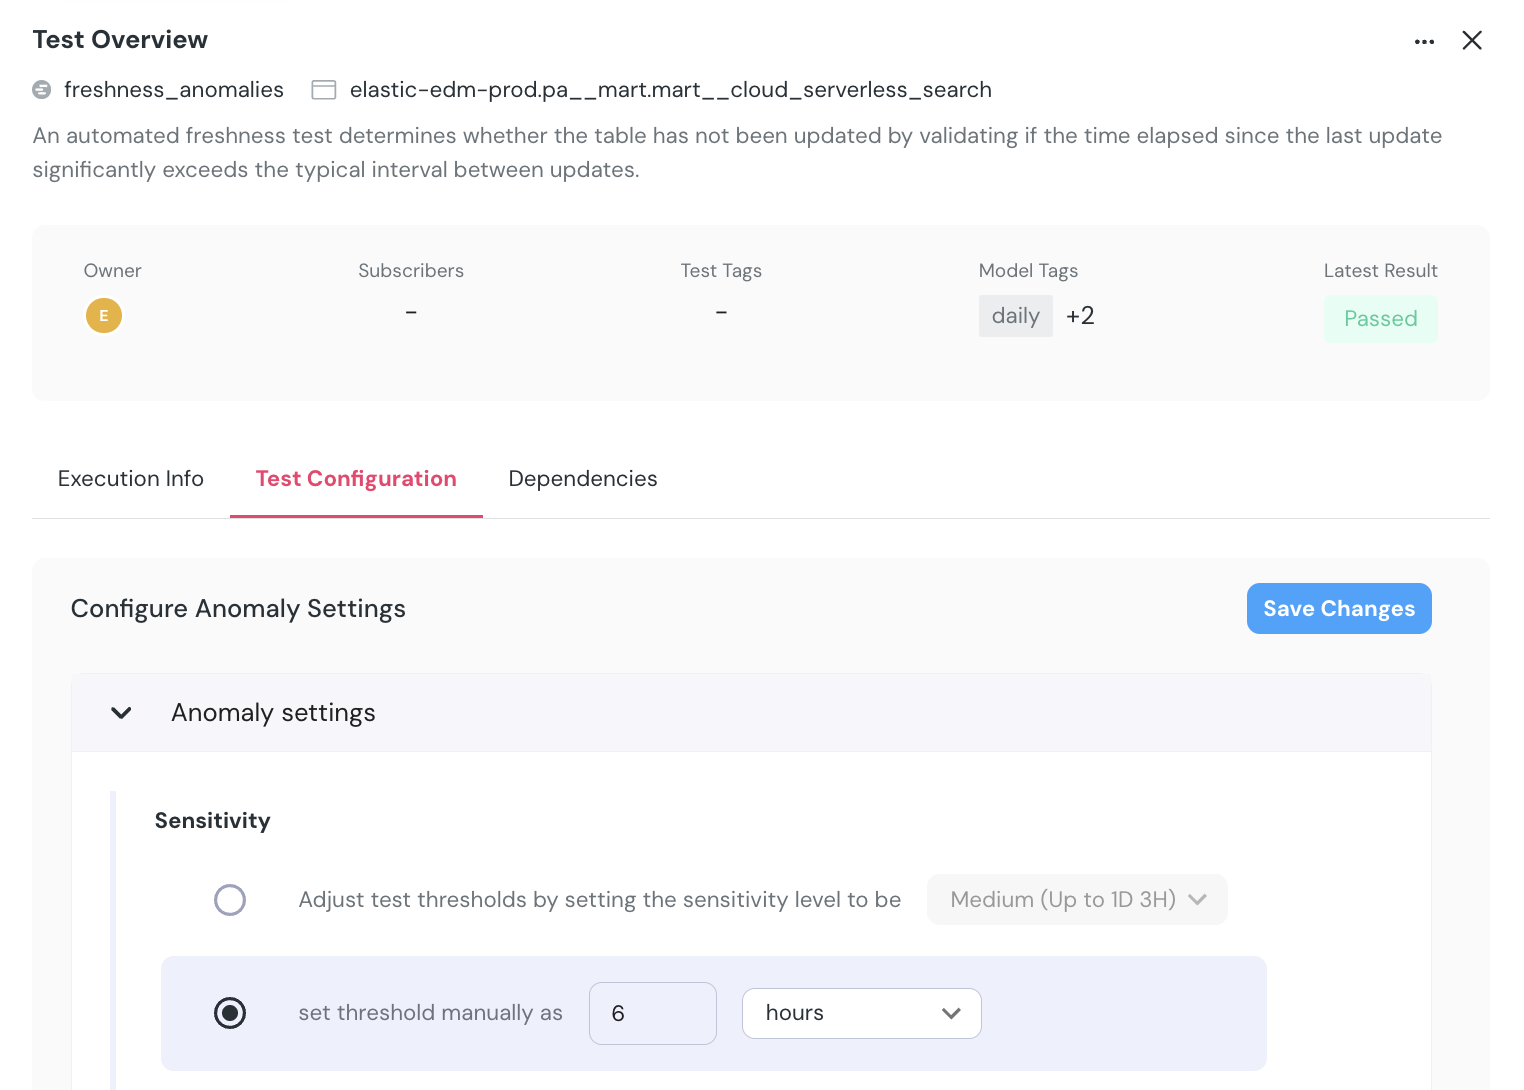
You can choose between 2 detection methods for the Freshness monitor- Automatic and Manual.- Automatic - Elementary uses machine learning models to detect anomalies in the data freshness. This is the default setting. You can change the sensitivity level to Low, Medium, or High.
For each level, you will see a simulation of the change impact on the latest result, and you can use the
Simulate Configurationbutton to examine the change impact. - Manual - You can set the SLA breach threshold for the freshness monitor manually. This is useful for assets that are updated regularly at the same time every day, hour or week.
- Severity - Should a failure be considered a warning or a failure. Default is warning.
- Test metadata - Add metadata such as tags and owner to the test.