Data Health Dashboard
The Data Health Dashboard is intended for your data consumers and stakeholders, that want to get a summary of what is happening with the data in your organization. It gives a high-level overview that doesn’t require deep technical knowledge or going into specific test results. the dashboard presents the data health in a simple way, by giving a health score, and using a color code to indicate if this score is healthy. Filters are available at the top of the page, making it easy to see the data health in different contexts.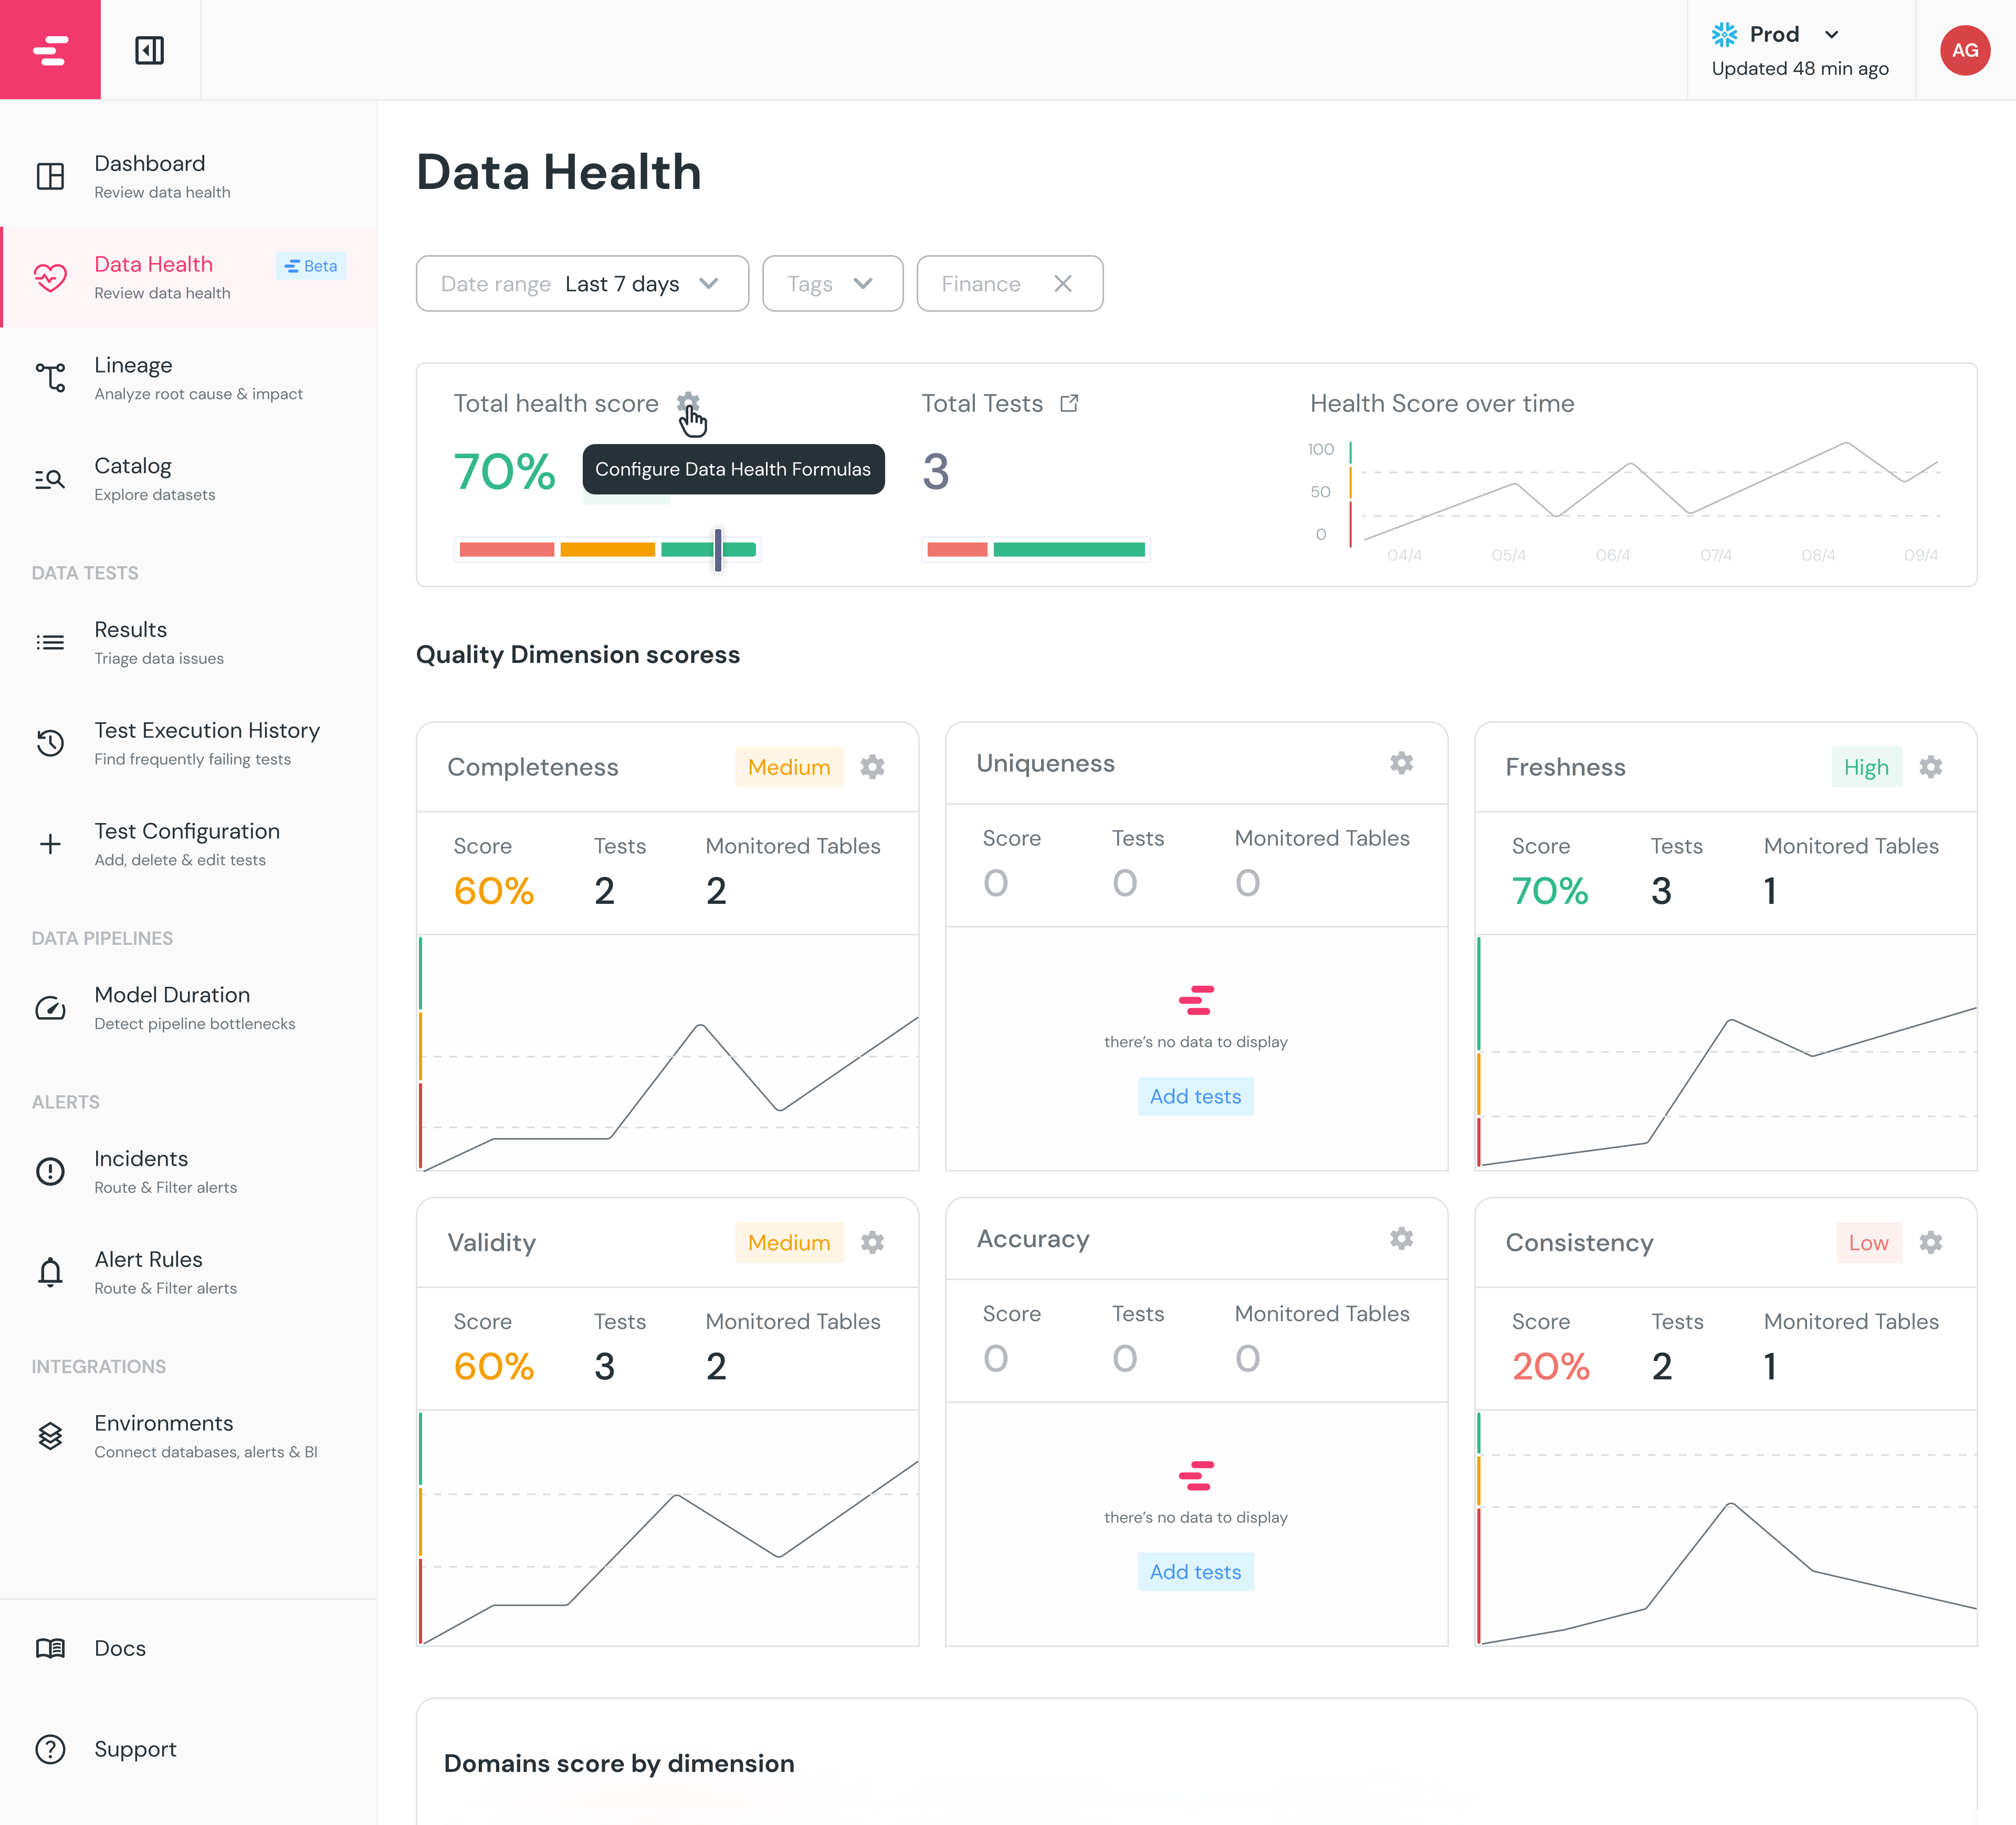 The dashboard is based on the 6 Data Quality Dimensions:
Freshness
Ensures that data is up to date and reflects the latest information.
Completeness
Ensures all required data is available, without missing values.
Accuracy
Ensures that data represents the real-world scenario correctly.
Consistency
The degree to which data remains uniform across multiple instances.
Uniqueness
Ensures that each entity is represented only once and there are no duplicates.
Validity
Ensures that data conforms to rules or expectations, such as acceptable ranges or formats.
How is the data health score calculated?
Each test you run in either dbt or Elementary is mapped to one of these pillars, and given a score. The scoring method is very simple:- If the test passes, the score is 100
- If the test is in
warnstatus, the score is 50 - If the test is in
failstatus, the score is 0

Critical assets alerts score
To focus on what matters most, see the top right of the screen to filter on your critical assets.Can I customize the quality dimension mapping of my tests?
Of course! Each test you run, whether it’s a generic or a custom test, can be mapped to one of the 6 quality dimensions. The way to do so is to addquality_dimension to the test definition in your dbt project:
Coming soon
- Send a daily report of the data health to your stakeholders
- Compare the data health of different domains
- Set up alerts for when the data health is below a certain threshold