

Freshness, volume, and data contract tests use warehouse metadata collected by Elementary. Custom SQL tests execute against table data and consume compute in your data warehouse.
Adding cloud tests
Cloud freshness and volume tests are activated automatically on all your sources. You can add additional tests from the UI or via the Test Recommendation Agent:- Navigate to the Test Configuration page and click Add Test. For asset-based tests, you can also start by selecting assets in the Catalog.
- Filter on Elementary Cloud and choose a test.
- Select the assets to test. For a custom SQL test, enter the query instead; Elementary derives its referenced assets from the SQL.
- Configure the test parameters, schedule, and metadata.
- Submit — no pull request is required.
Editing cloud tests
Open any test result and go to its configuration. The available settings depend on the test type. For freshness and volume tests, you can:- Adjust sensitivity (Low / Medium / High) to reduce noise or increase detection precision
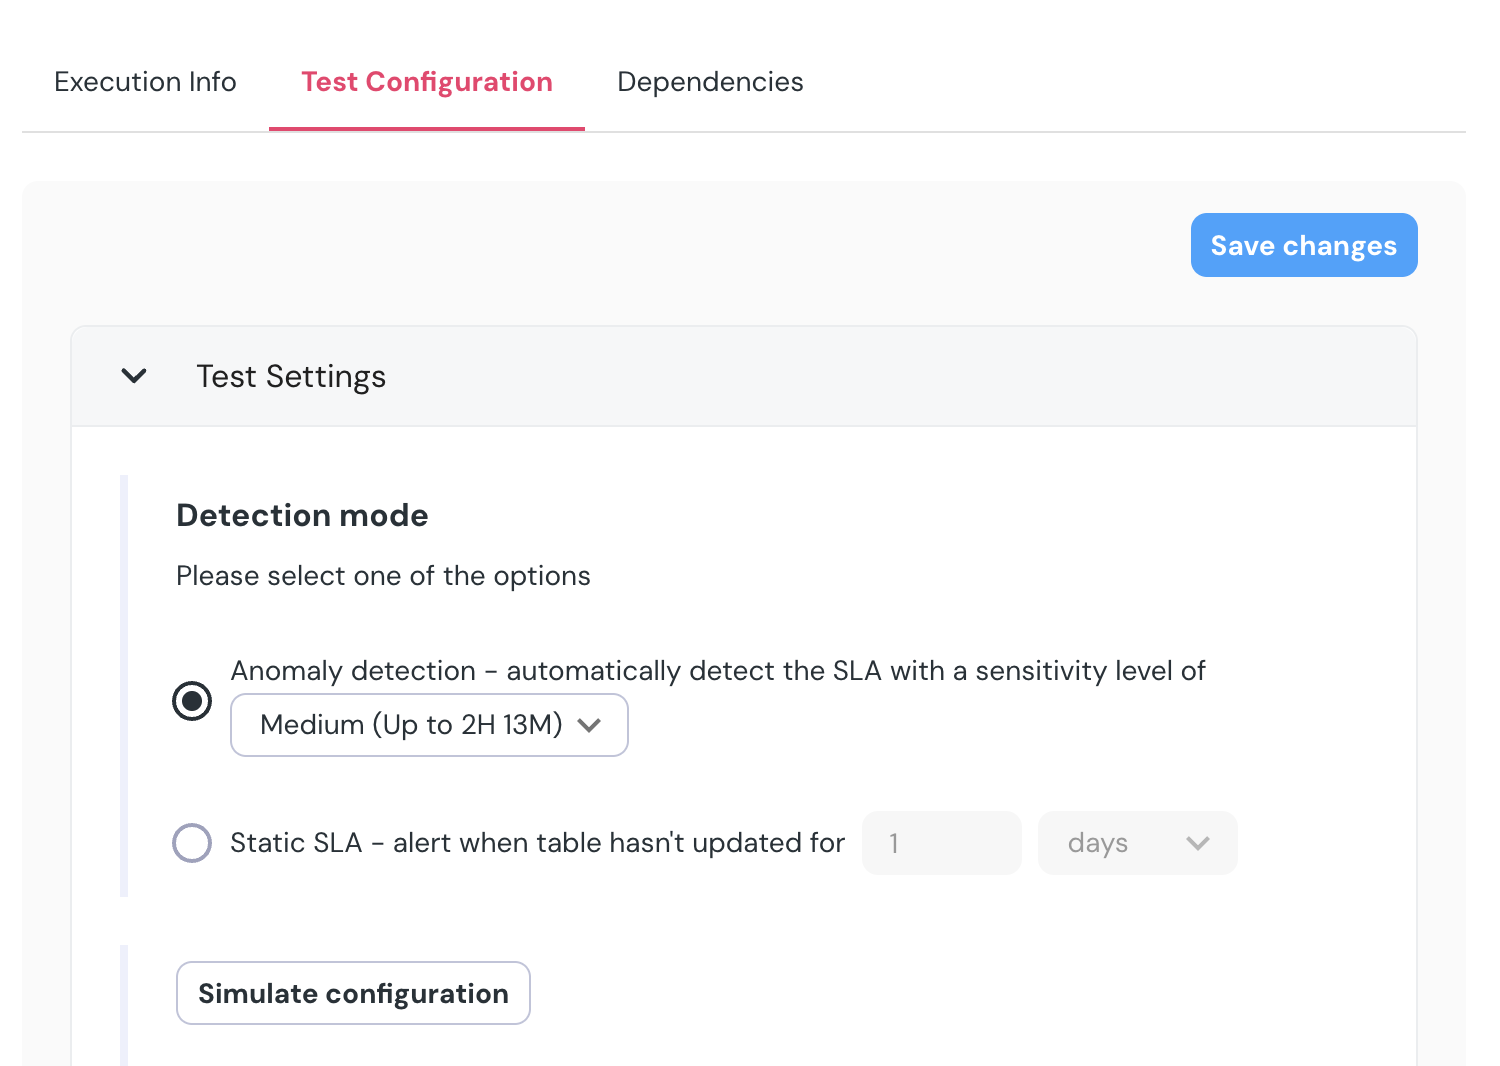
- Switch between automatic (ML-based) and manual (SLA threshold) modes for freshness
- Change the detection period — the window in which the monitor looks for anomalies
- Set anomaly direction — fail on drops, spikes, or both
Simulate configuration
After changing any setting, use Simulate Configuration to preview how the change would have affected recent results before saving.Exclude time ranges
Training periods sometimes include one-time anomalies — a manual script run, a known incident — that skew the model and causeNO_DATA results. You can exclude specific time ranges so the model learns from clean data only.
- Click Exclude in the top-right of the chart, or go to the Test Configurations tab
- Mark the section of the chart you want to exclude
- Confirm — the excluded range appears under Excluded time ranges and can be edited or removed
Removing cloud tests
- From the Test Configuration page: select one or more tests and use the delete option at the bottom
- From a test result: click
...→ Delete test
Supported settings
All cloud tests
- Severity - Should a failure be considered a warning or a failure. Default is warning.
- Test metadata - Add metadata such as tags and owner to the test.
Volume test
- Anomaly Direction - Whether you want the monitor to fail on anomalous drops, spikes, or both. Default is both.
- Sensitivity - You can set the monitor’s sensitivity levels to Low, Medium, or High. In the future, we plan to allow for more nuanced adjustments to this parameter. You can use the
Simulate Configurationbutton for testing how the change will affect the monitor. - Detection Period - The period in which the monitor look for anomalies. Default is the last 2 days.
Freshness test
You can choose between 2 detection methods for the Freshness monitor- Automatic and Manual.- Automatic - Elementary uses machine learning models to detect anomalies in the data freshness. This is the default setting. You can change the sensitivity level to Low, Medium, or High.
For each level, you will see a simulation of the change impact on the latest result, and you can use the
Simulate Configurationbutton to examine the change impact. - Manual - You can set the SLA breach threshold for the freshness monitor manually. This is useful for assets that are updated regularly at the same time every day, hour or week.
Result feedback
Use the Result feedback button on any test result to mark it as a true or false positive. Feedback improves the accuracy of the ML models over time. For false positives, select a reason:- Insignificant change — the anomaly isn’t impactful enough to act on; consider relaxing sensitivity
- Expected outlier — the value should be within the expected range; triggers model retraining
- Business anomaly — expected due to an intentional change or event; excludes the result from training
- Not an interesting table — stop monitoring this table; deletes the monitor
- Other — add a comment to describe the case
Metrics
Collect and monitor custom metrics using theelementary.collect_metrics dbt test. Metrics are synced to Elementary Cloud and can have anomaly detection applied automatically.
For tests that run in your dbt pipeline, including dbt singular tests written in SQL, see the dbt Package and Tests tab.