Overview
When enabled, Elementary automatically streams your workspace’s audit logs (user activity logs and system logs) to Splunk using the Splunk HTTP Event Collector (HEC). This allows you to:- Centralize all logs in your Splunk instance
- Set up custom alerts and dashboards on log events
- Correlate Elementary logs with other application logs
- Perform advanced log analysis and search using Splunk’s powerful query language
- Maintain long-term log retention in Splunk
Prerequisites
Before configuring log streaming to Splunk, you’ll need:-
Splunk Instance - A Splunk Enterprise or Splunk Cloud instance with HTTP Event Collector (HEC) enabled
- HEC must be configured and accessible from Elementary’s servers
- You’ll need the HEC URL (e.g.,
https://splunk.example.com:8088)
-
HEC Token - An HTTP Event Collector token for authentication
- You can create a token in Splunk under Settings > Data Inputs > HTTP Event Collector
- The token must have write permissions
-
Splunk Index (optional) - A specific index where logs should be stored
- If not specified, logs will be sent to the default index configured for the HEC token
Configuring Log Streaming to Splunk
-
Navigate to the Logs page:
- Click on your account name in the top-right corner of the UI
- Open the dropdown menu
- Select Logs
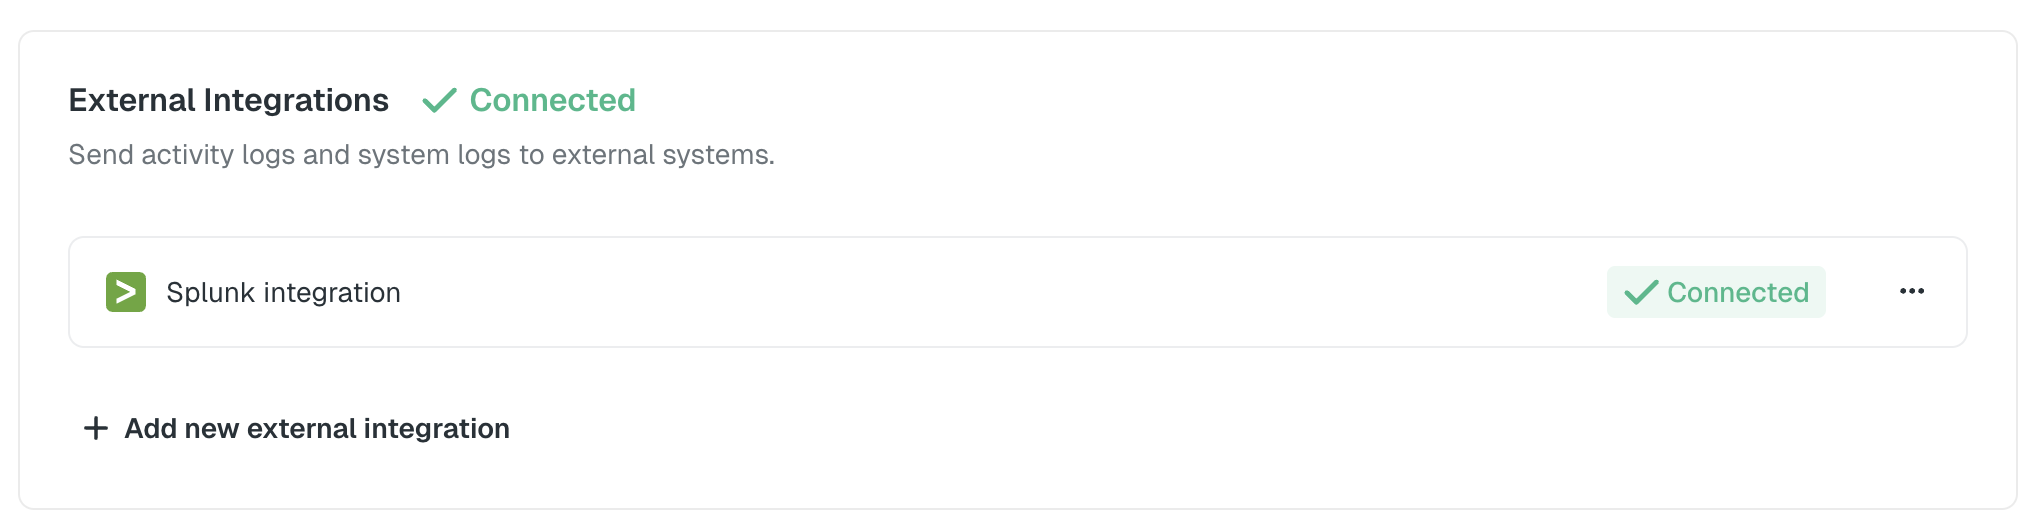
- In the External Integrations section, click the Connect button
- In the modal that opens, select Splunk as your log streaming destination
-
Enter your Splunk configuration:
- HEC URL: Your Splunk HTTP Event Collector URL (e.g.,
https://splunk.example.com:8088orhttps://example.splunkcloud.com:8088) - HEC Token: Your Splunk HEC authentication token
- Index (optional): The Splunk index where logs should be stored (defaults to the token’s configured index if not specified)
- HEC URL: Your Splunk HTTP Event Collector URL (e.g.,
- Click Save to enable log streaming
The log streaming configuration applies to your entire workspace. Both user activity logs and system logs will be streamed to Splunk in batches.
Log Format in Splunk
Logs are sent to Splunk with the following structure:Event Structure
Each log entry is sent as a JSON event with the following fields:event: The log data as a JSON objectsourcetype:_json(indicating JSON format)source:elementary-cloud(identifying the source)time: Unix timestamp of the eventindex: The Splunk index (if specified in configuration)
User Activity Logs
Each user activity log entry includes:System Logs
Each system log entry includes:Field Descriptions
timestamp: ISO 8601 timestamp of the event (UTC)log_type: Either"audit"for user activity logs or"system"for system logsevent_name: The specific action that was performed (e.g.,user_login,create_test,dbt_data_sync_completed)success: Boolean indicating whether the action completed successfullyuser_email: User email addressuser_name: User display nameenv_id: Environment identifier (empty for account-level actions)env_name: Environment name (empty for account-level actions)event_content: Additional context-specific information as a JSON object
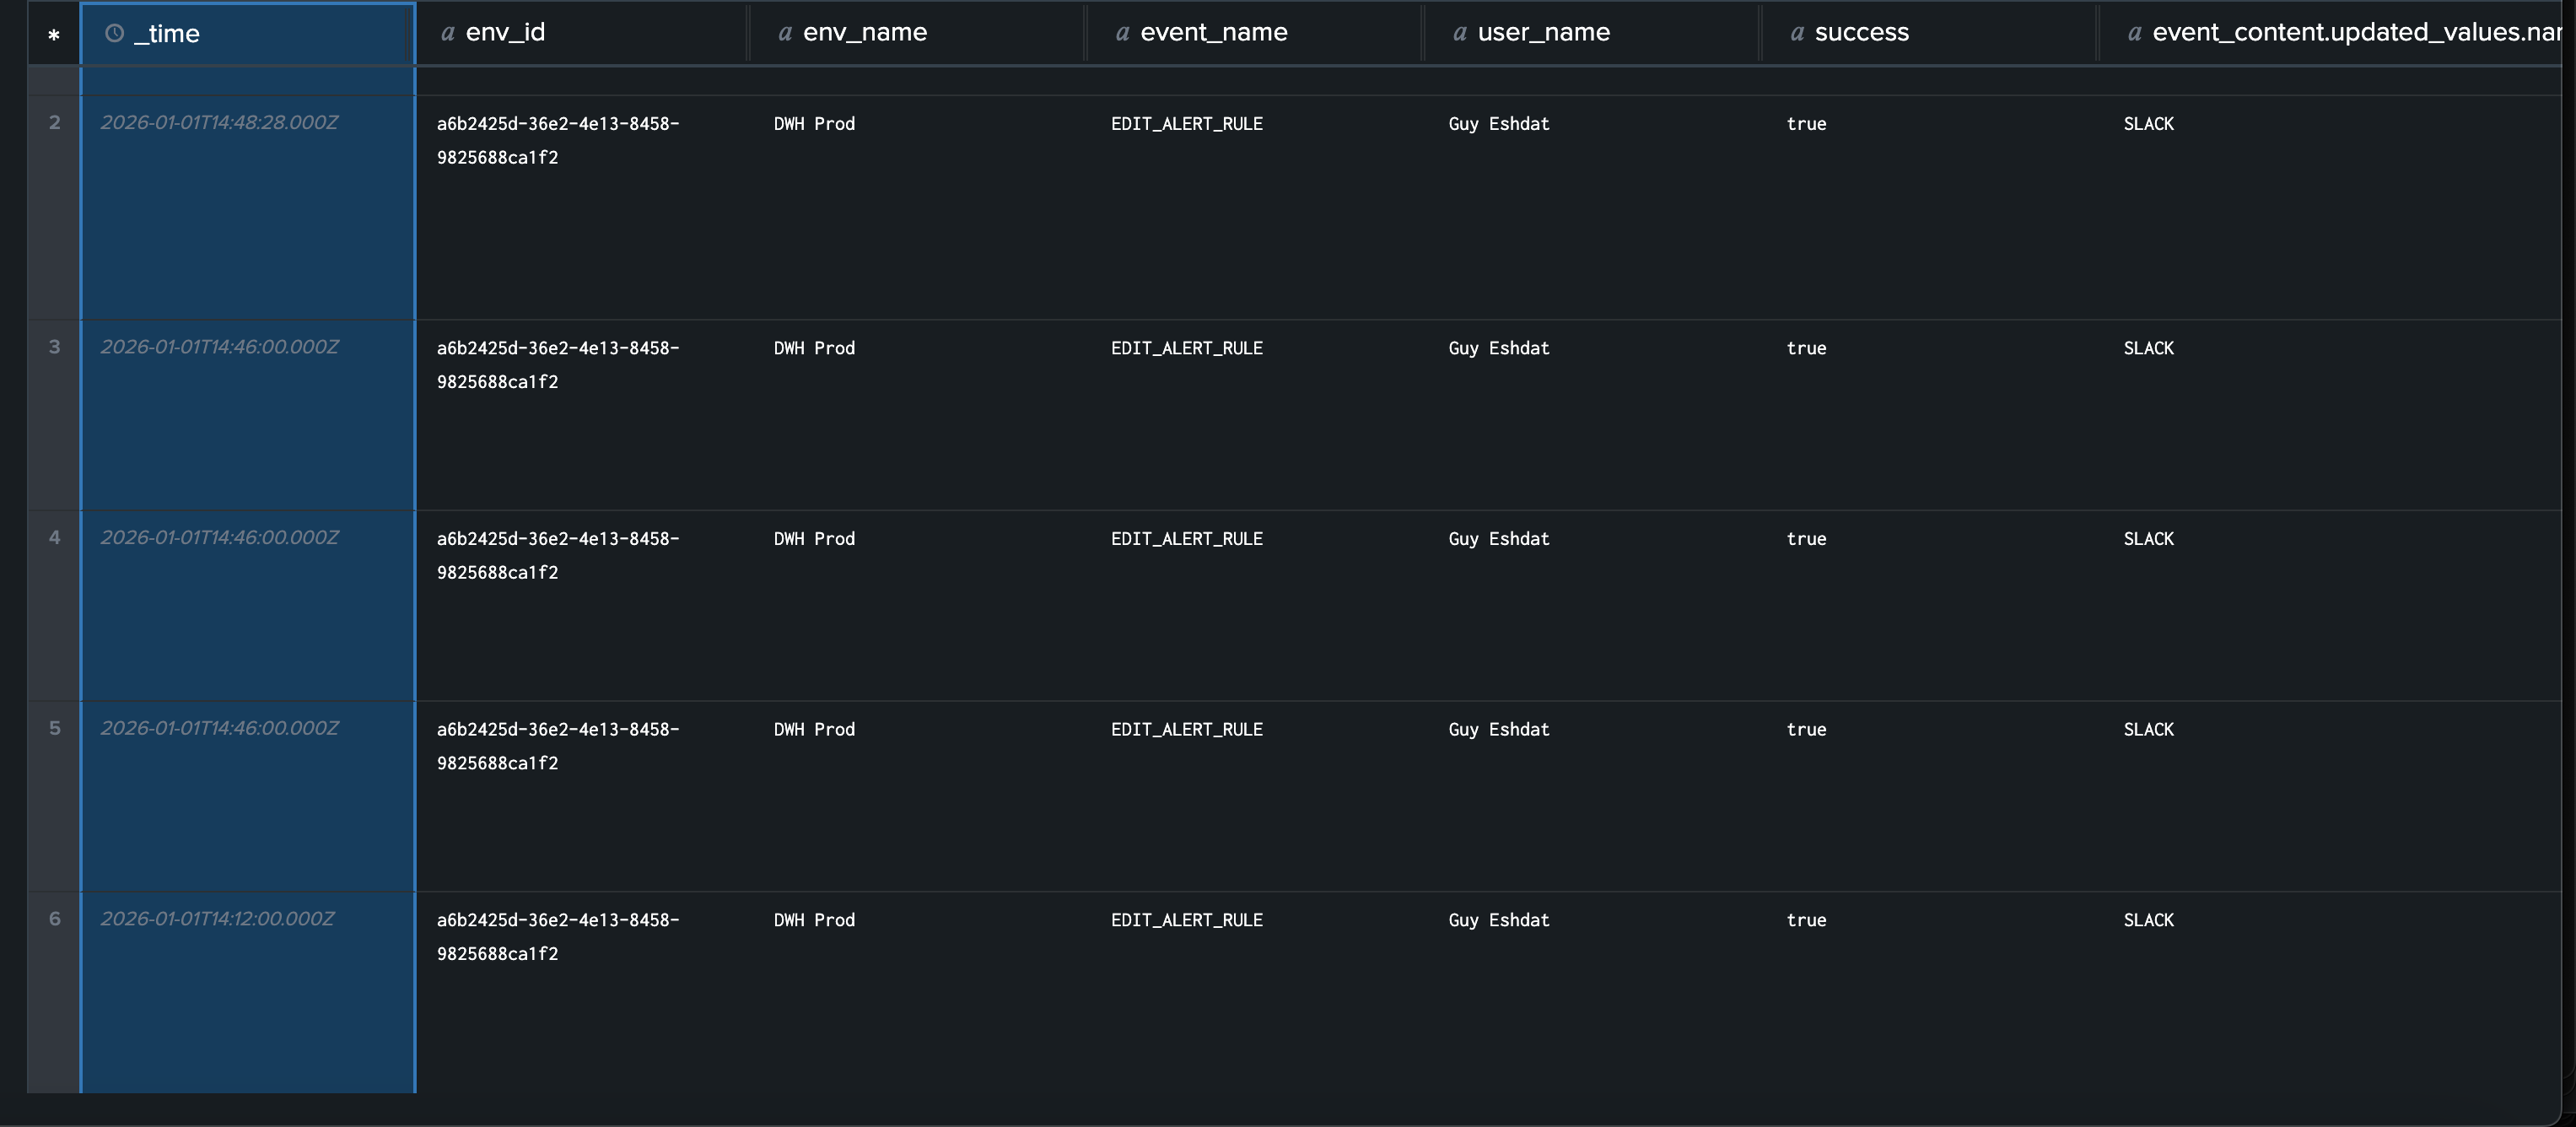
Viewing Logs in Splunk
Once configured, logs will appear in your Splunk instance within a few seconds of being generated. You can search logs using Splunk Search Processing Language (SPL):Disabling Log Streaming
To disable log streaming to Splunk:- Navigate to the Logs page
- In the External Integrations section, find your Splunk integration
- Click Disable or remove the Splunk configuration
- Confirm the action