Overview
When enabled, Elementary automatically streams your workspace’s audit logs (user activity logs and system logs) to Datadog using the Datadog Logs API. This allows you to:- Centralize all logs in your Datadog dashboard
- Set up custom alerts and monitors on log events
- Correlate Elementary logs with other application logs
- Perform advanced log analysis and search
- Maintain long-term log retention in Datadog
Prerequisites
Before configuring log streaming to Datadog, you’ll need:-
Datadog API Key - Your Datadog API key for authentication
- You can find or create an API key in your Datadog account under Organization Settings > API Keys
-
Datadog Site (optional) - Your Datadog site region
- Default:
datadoghq.com(US) - EU:
datadoghq.eu - US3:
us3.datadoghq.com - US5:
us5.datadoghq.com - AP1:
ap1.datadoghq.com
- Default:
Configuring Log Streaming to Datadog
-
Navigate to the Logs page:
- Click on your account name in the top-right corner of the UI
- Open the dropdown menu
- Select Logs
- In the External Integrations section, click the Connect button
- In the modal that opens, select Datadog as your log streaming destination
-
Enter your Datadog configuration:
- API Key: Your Datadog API key
- Site (optional): Your Datadog site region (defaults to
datadoghq.comif not specified) - Service Name (optional): Custom service name for logs in Datadog (defaults to
elementary) - Source (optional): Custom source tag for logs (defaults to
elementary-cloud)
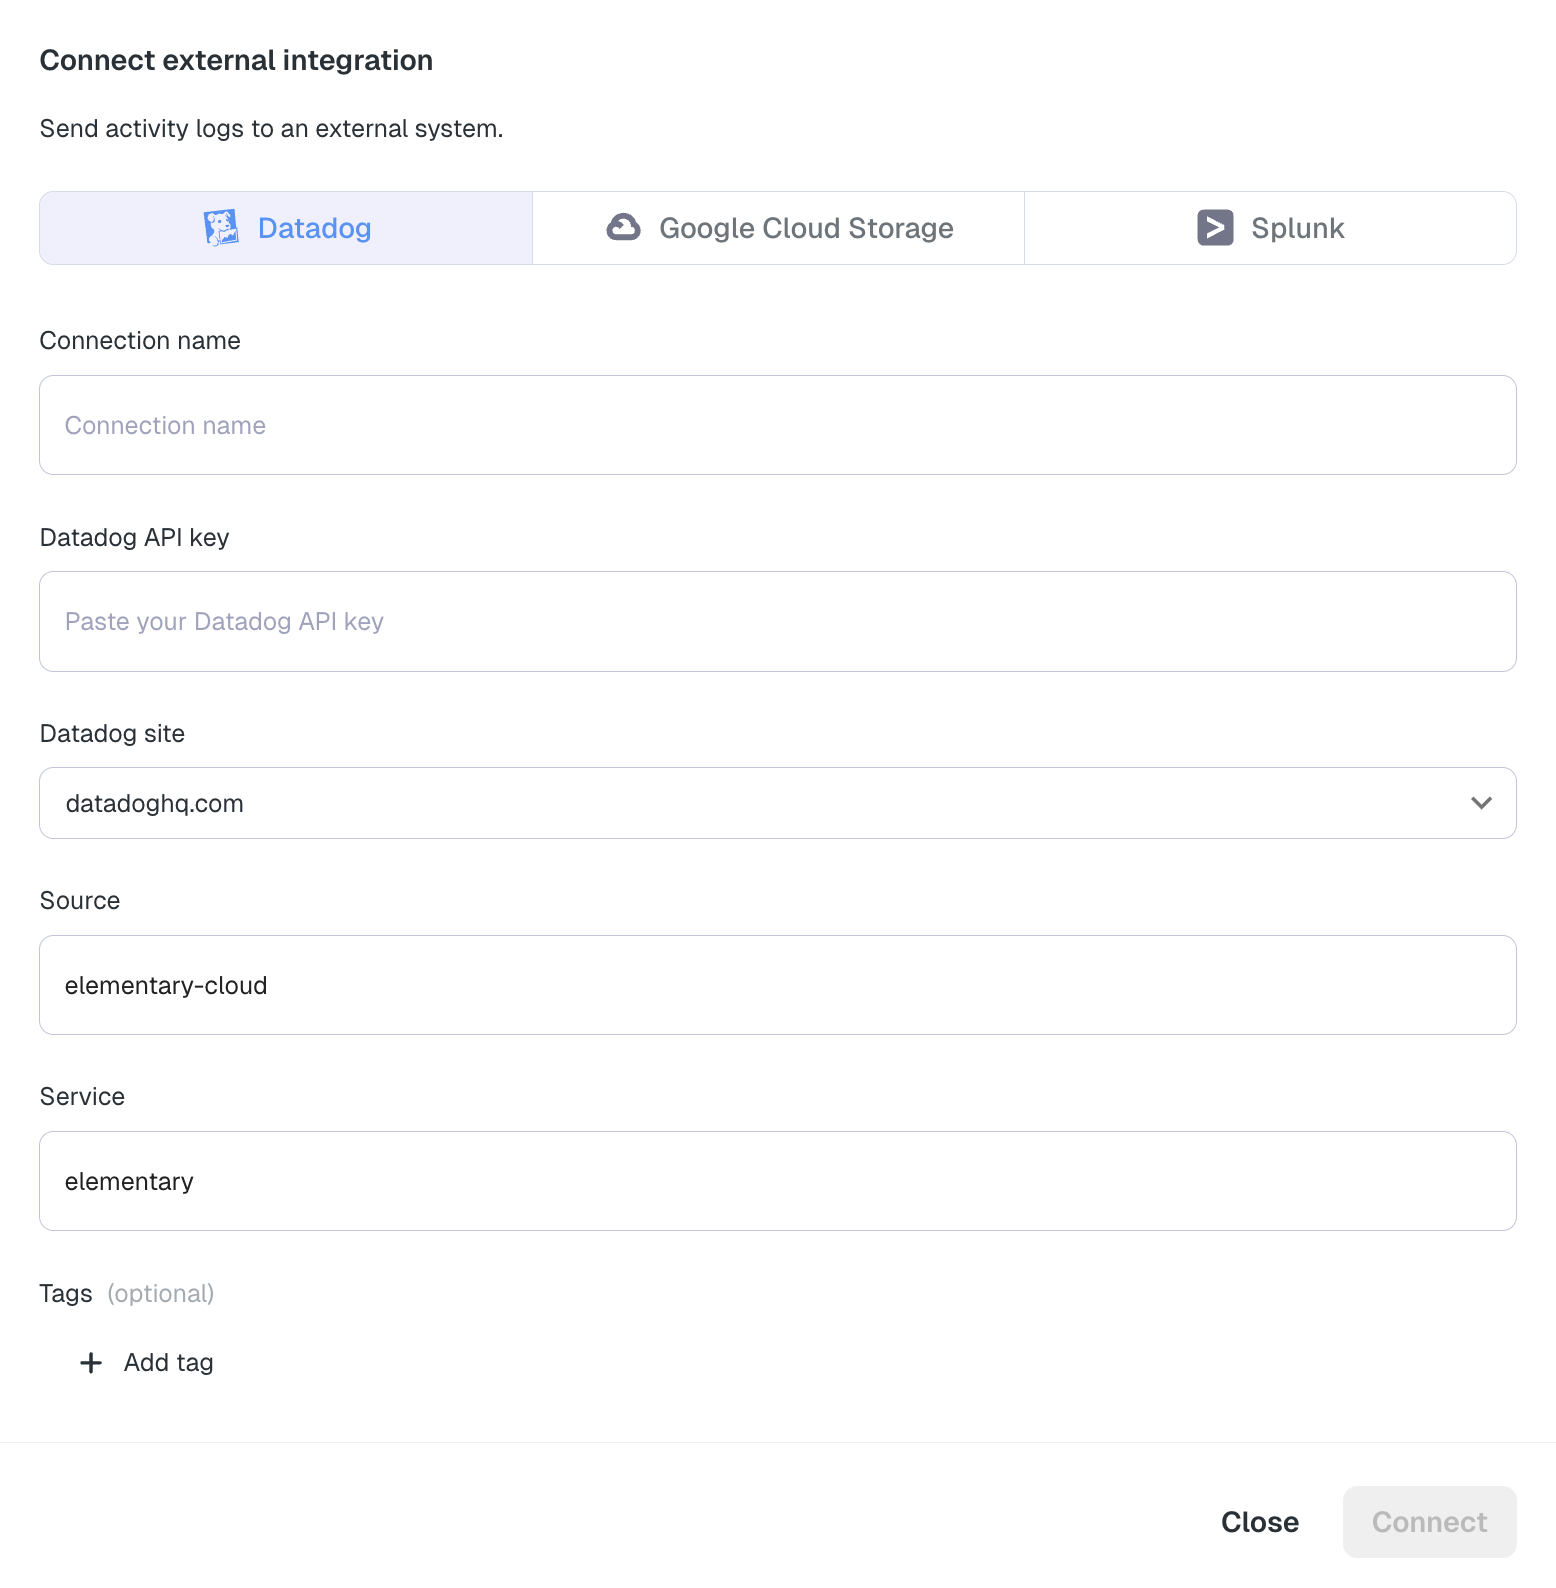
- Click Connect to enable log streaming
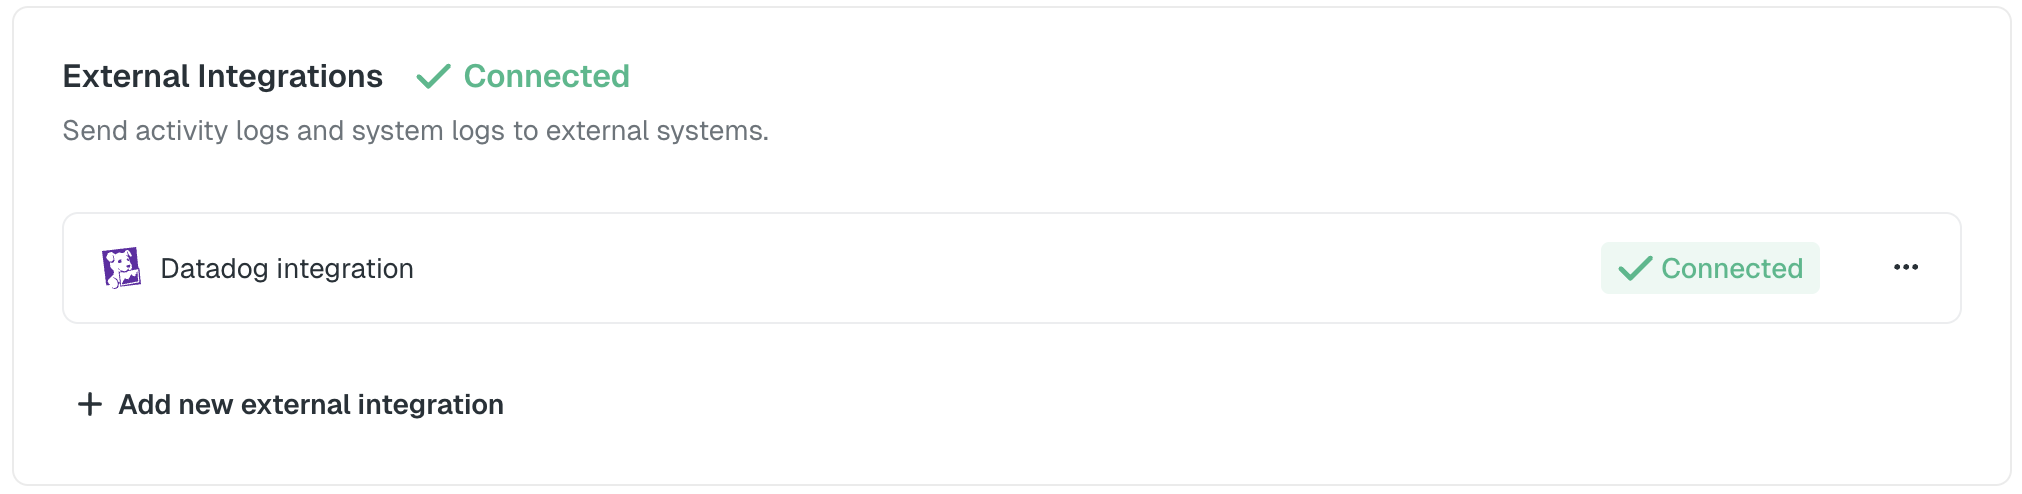
- After connecting, you will see the Datadog integration listed in the External Integrations section. You can edit or disable the integration at any time.
The log streaming configuration applies to your entire workspace. All logs matching your selected log types will be streamed to Datadog in real-time.
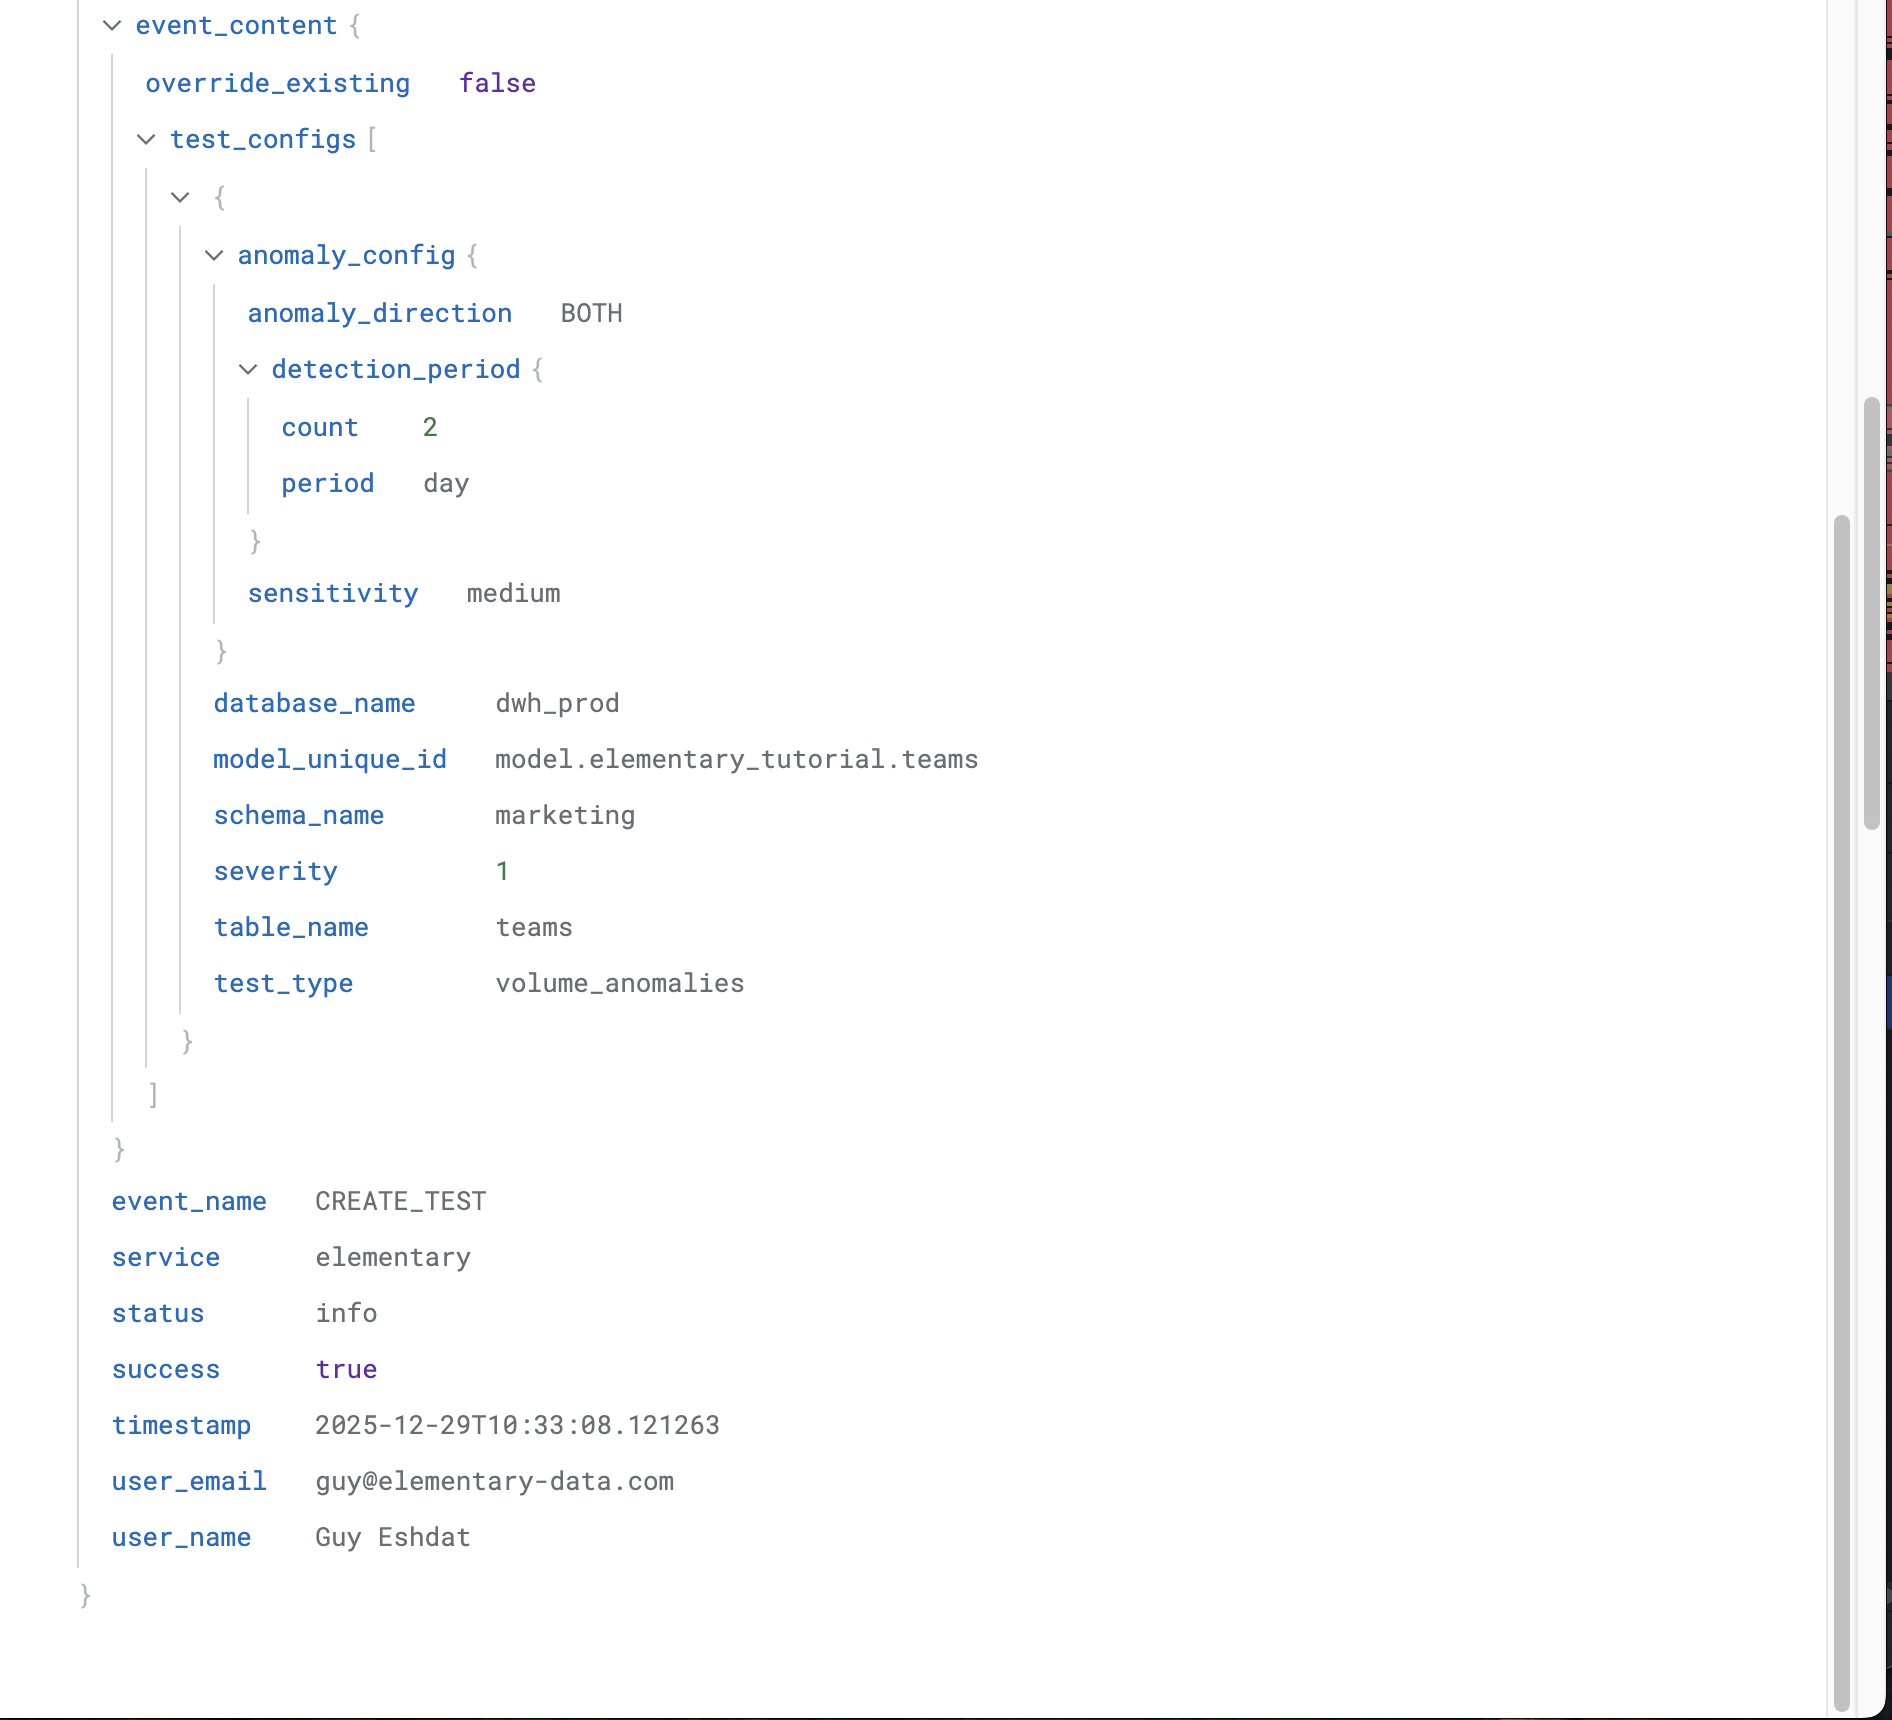
Log Format in Datadog
Logs are sent to Datadog with the following structure:timestamp: ISO 8601 timestamp of the eventlog_type: The type of log (auditfor user activity logs,systemfor system logs)status: Log level (infofor successful actions,errorfor failed actions)service: Service name (configurable, defaults toelementary)source: Source tag (configurable, defaults toelementary-cloud)event_name: The specific action that was performed (e.g.,user_login,create_test)success: Boolean indicating whether the action completed successfullyuser_email: User email address (only present in audit logs)user_name: User display name (only present in audit logs)env_id: Environment identifier (empty for account-level actions)env_name: Environment name (empty for account-level actions)event_content: Additional context-specific information as a JSON objectdd.tags: Additional tags including:log_type:<log_type>(e.g.,audit,system)event_name:<event_name>(e.g.,user_login,create_test)env_id:<environment_id>(if applicable)
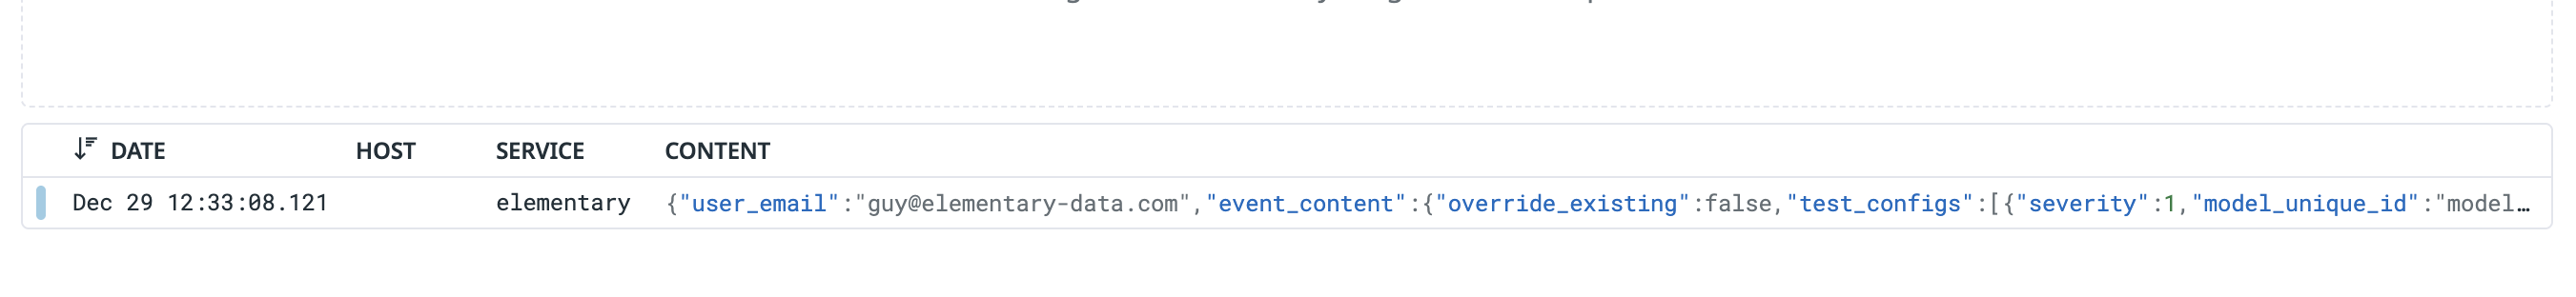
Viewing Logs in Datadog
Once configured, logs will appear in your Datadog Log Explorer within a few seconds of being generated. You can filter logs using:source:elementary-cloud- All Elementary logslog_type:audit- User activity logs onlylog_type:system- System logs onlyevent_name:<event_name>- Specific action typesenv_id:<environment_id>- Logs from a specific environmentsuccess:false- Failed operations only
Troubleshooting
Logs not appearing in Datadog
- Verify API Key: Ensure your Datadog API key is valid and has the necessary permissions
- Check Site Configuration: Verify you’ve selected the correct Datadog site region
- Review Log Types: Confirm the log types you want to stream are enabled
- Check Datadog Status: Verify your Datadog account is active and not rate-limited
Rate Limiting
Datadog has rate limits for log ingestion. If you’re experiencing issues:- Check your Datadog account’s rate limits in the Usage & Billing page
- Consider filtering which log types you stream if you have high log volume
- Contact Datadog support if you need to increase your rate limits
Disabling Log Streaming
To disable log streaming to Datadog:- Navigate to the Logs page
- In the External Integrations section, find your Datadog integration
- Click Disable or remove the Datadog configuration
- Confirm the action