Documentation Index
Fetch the complete documentation index at: https://docs.elementary-data.com/llms.txt
Use this file to discover all available pages before exploring further.
Critical Assets
We’re excited to introduce the Critical Assets feature, designed to help you prioritize and protect your most important data assets. What is a Critical Asset? A critical asset is any data asset (such as a model, exposure, or report) that plays a crucial role in your company’s data ecosystem. Issues affecting these assets can have a significant impact on business operations, dashboards, and decision-making. Marking an asset as critical ensures it receives higher priority in monitoring and alerting, helping you quickly identify and respond to issues that may impact it. Once an asset is marked as critical, you will be able to: ✅ Identify it in the UI, where it will be visually highlighted. ✅ Receive alerts when upstream issues may impact the critical asset. ✅ Filter incidents by their impact on critical assets. Learn more about how to use Critical Assets in our docs.
Mute tests
We’re pleased to introduce the Mute Test feature! This allows you to run tests without triggering alerts, giving you greater control over notifications while still monitoring your data. It’s perfect for scenarios where you’re testing new data sets, refining thresholds, or adjusting test logic—without unnecessary noise. With this feature, you can ensure everything is working as expected before enabling alerts, keeping your team focused and informed only when it truly matters. Learn more how to mute tests in our docs.
Custom metadata
Custom attributes from ****dbt’s meta field are now visible in the Elementary catalog, enhancing context and improving collaboration by bringing key metadata directly into your observability workflows. We understand that not all meta attributes are relevant for every team. If there are specific meta attributes you’d like to see in the catalog, please reach out to us at Elementary. Let us know your preferences, and we’ll configure the catalog to display the metadata most valuable to you.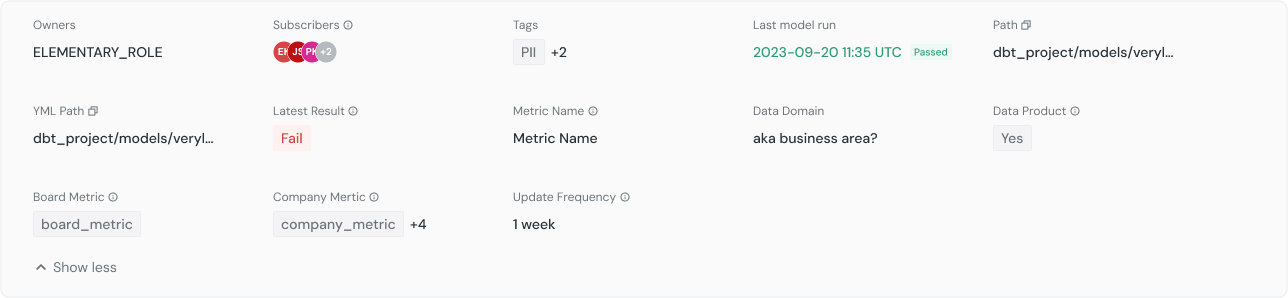
Manually Set SLAs for Freshness Tests
You can now set a manual threshold for Elementary’s freshness tests. While our automated freshness test uses anomaly detection to identify unusual delays in table updates, sometimes you need more precise control. With manual thresholds, you can explicitly define when a freshness test should fail, giving you full control over monitoring your data freshness requirements. Simply set your desired threshold, and you’ll be notified whenever a table hasn’t refreshed within that time limit. Learn more about automated freshness tests in our docs.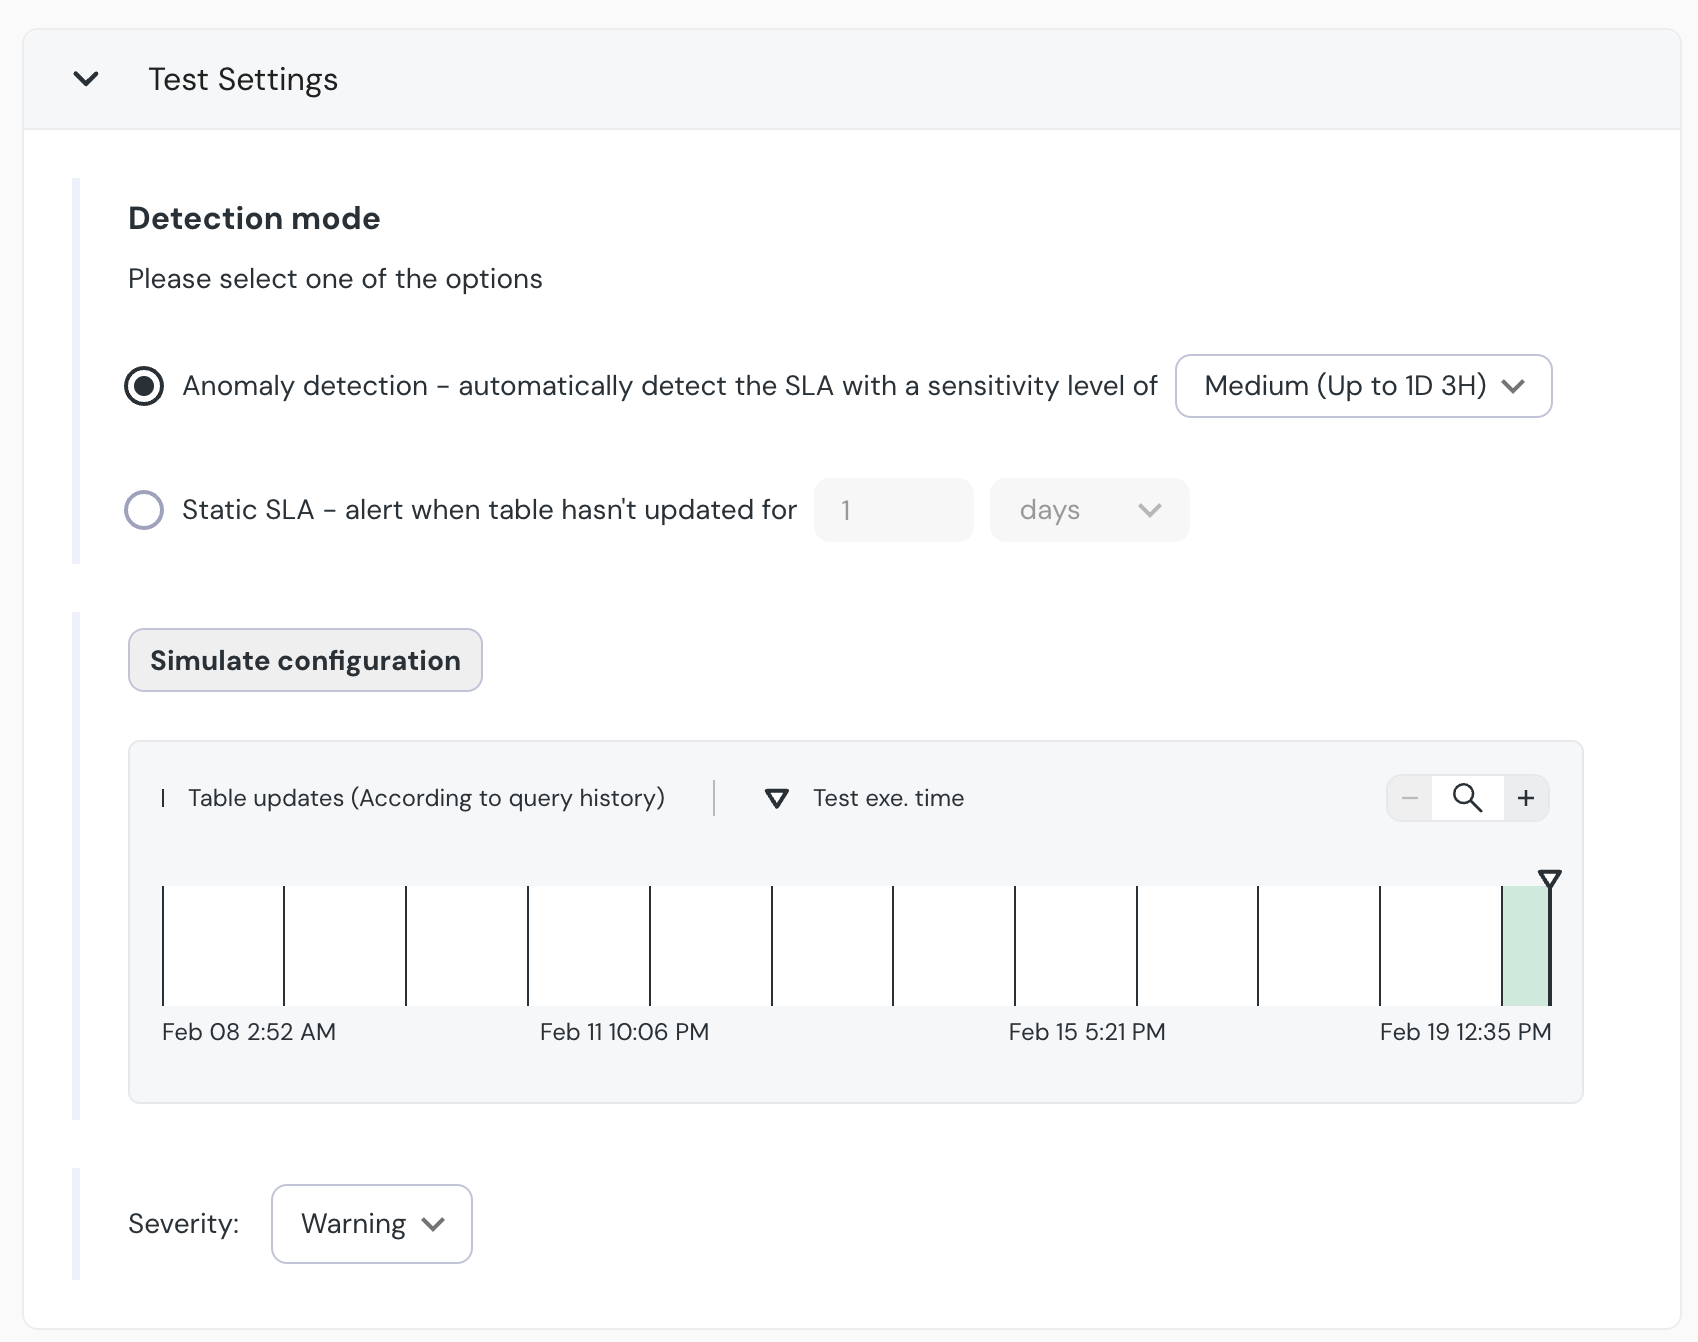
Connect Multiple BI Tools in Lineage
Elementary now supports connecting multiple BI tools, bringing even more visibility into your data. Once connected, BI metadata will appear in both the catalog and the lineage graph. Currently, Elementary integrates with Looker, Tableau, Power BI, and Sigma—with more to come!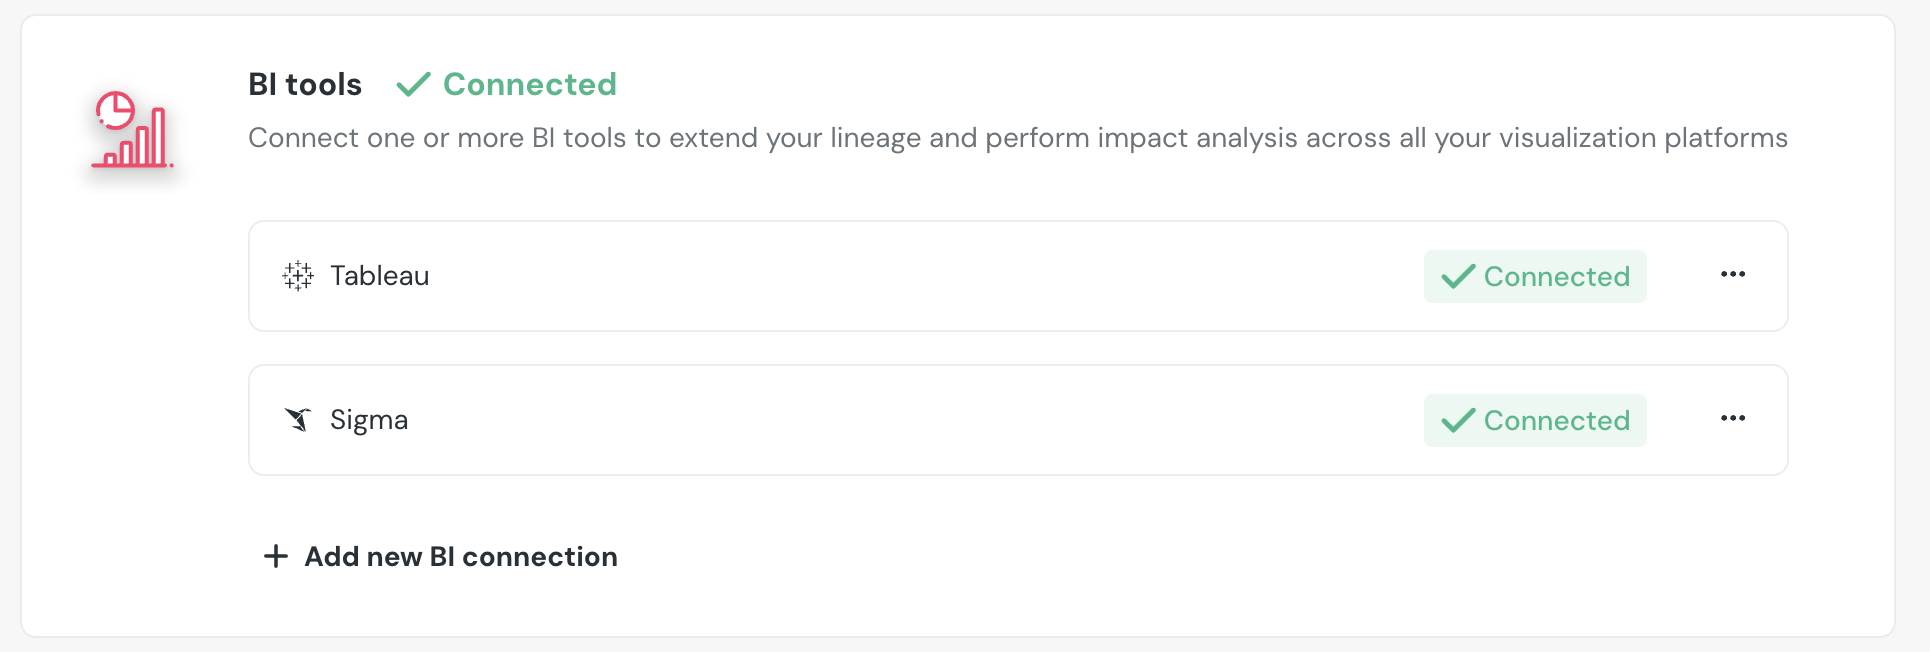
Easier Test Creation
We improved the test creation UI to make it easier to create tests. Given the fantastic response to the dbt tests hub we introduced a few months ago, we decided to bring the test hub into the platform. You can now search directly from the Elementary UI, select the desired test, and create it directly from the UI using the YAML format provided with examples and explanations, then add owners, tags, severity, etc, and open a PR. Learn more about test creation in Elementary.
New Integrations: Jira & Linear
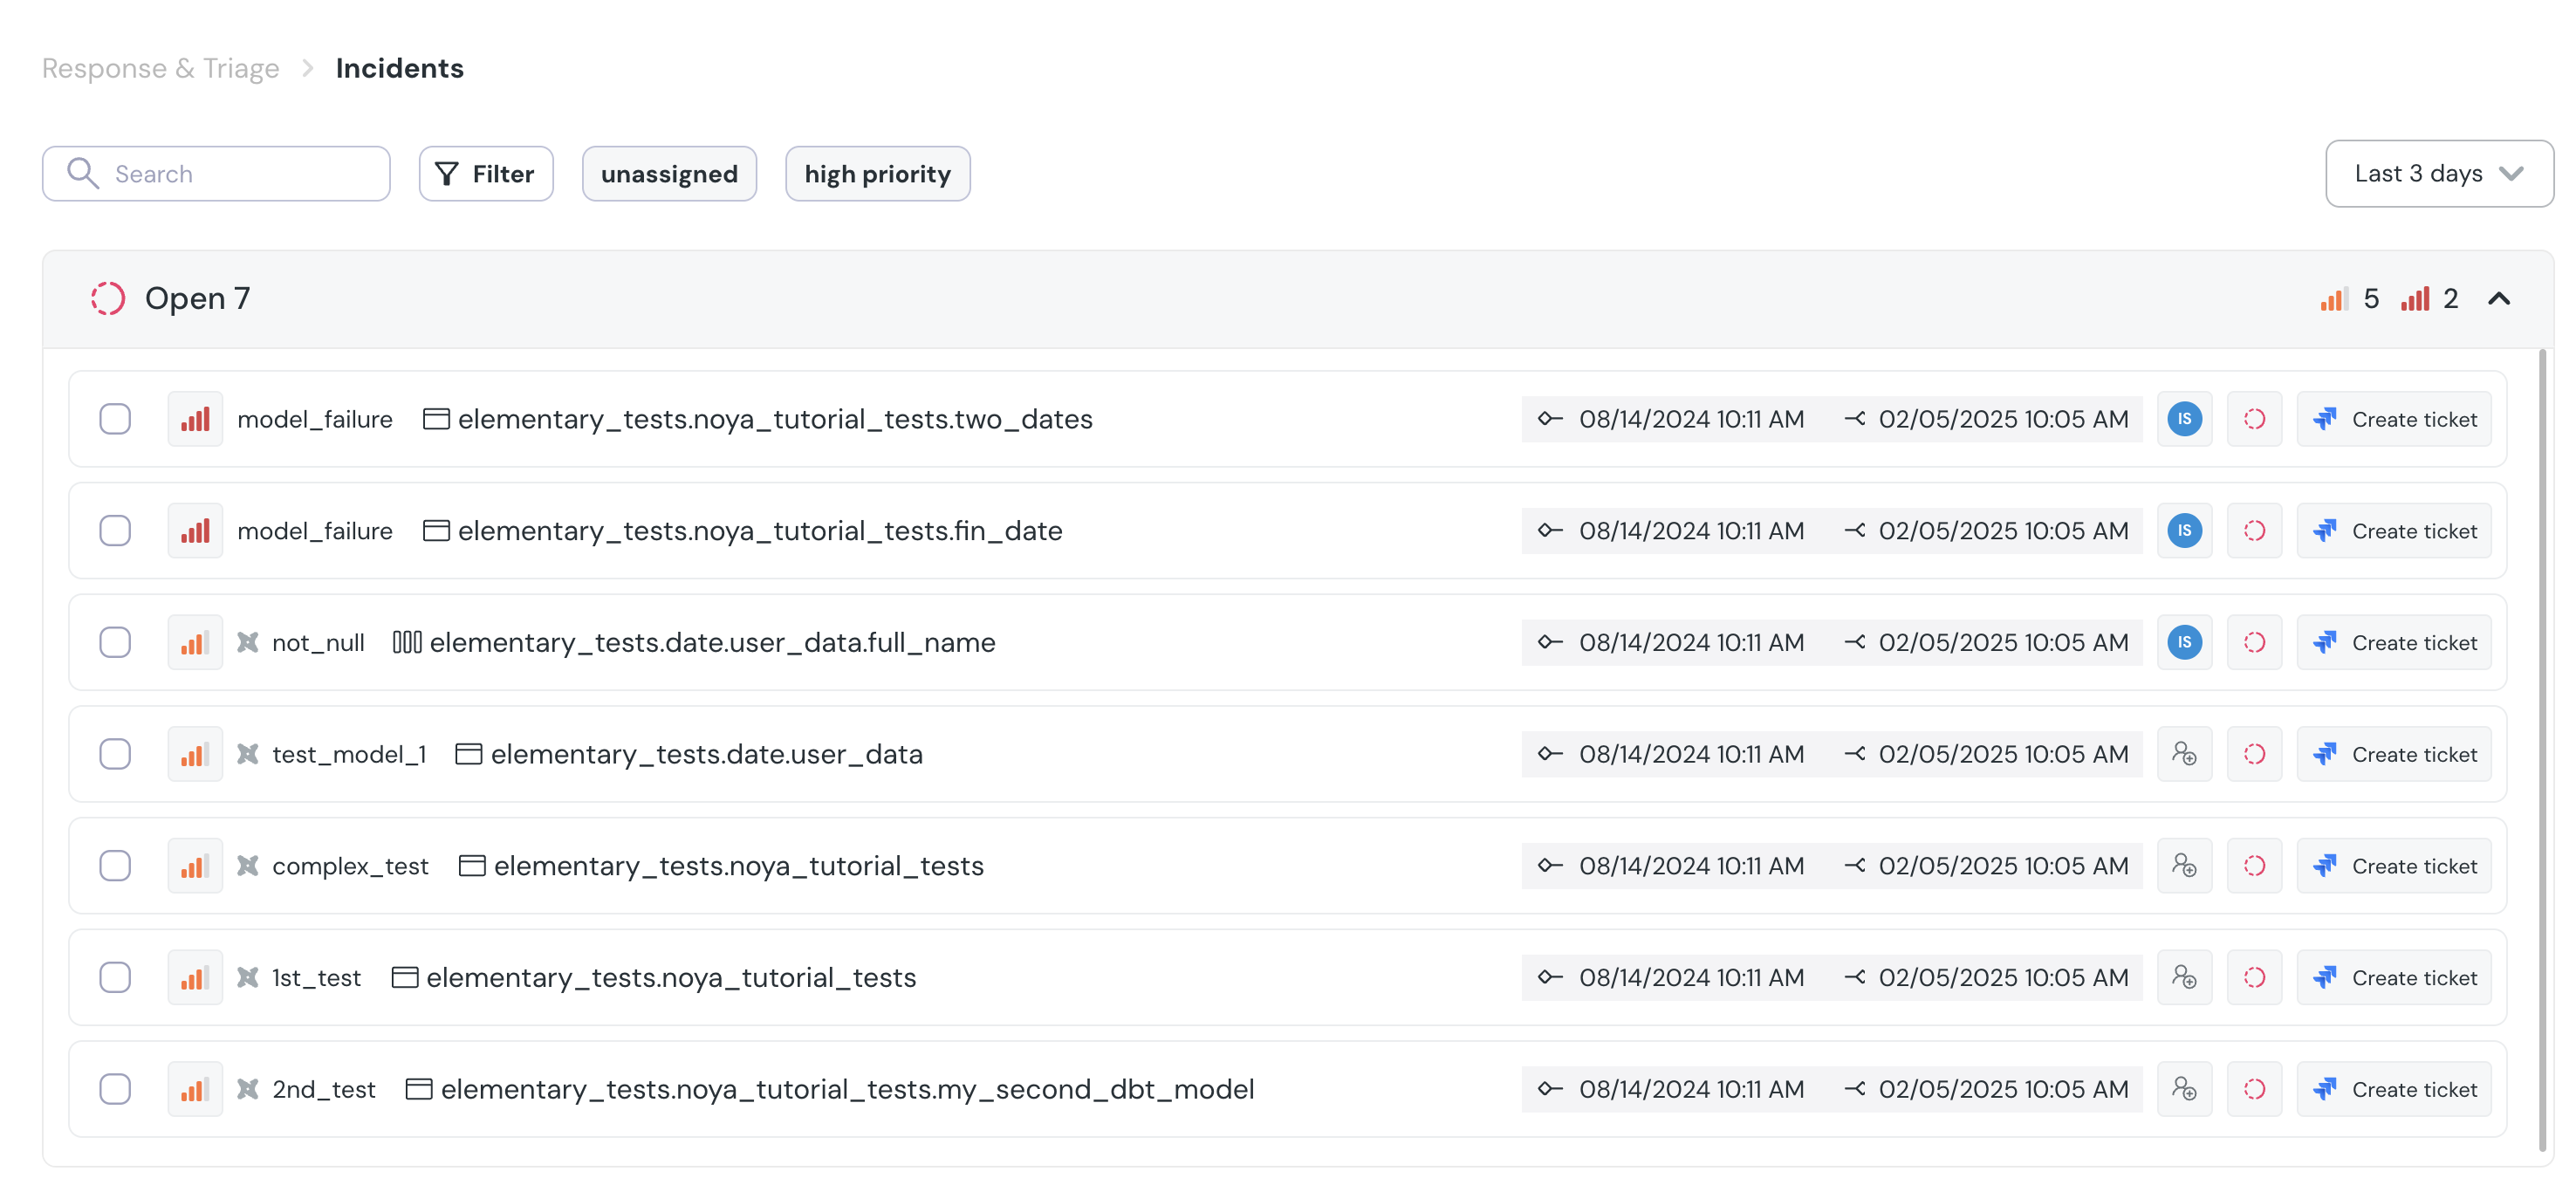
We’re excited to announce that you can now integrate Elementary with Jira or Linear to streamline your incident management process. With this integration, you can create new Jira or Linear tickets directly from Elementary. Once you connect your account, a ‘Create Ticket’ button will appear next to each incident in the incident management screen. Jira and Linear tickets created through Elementary will automatically include key details like the test name, description, query, results, and more—ensuring all relevant context is captured and shared. Learn more about connecting Elementary to Jira or Linear in our docs.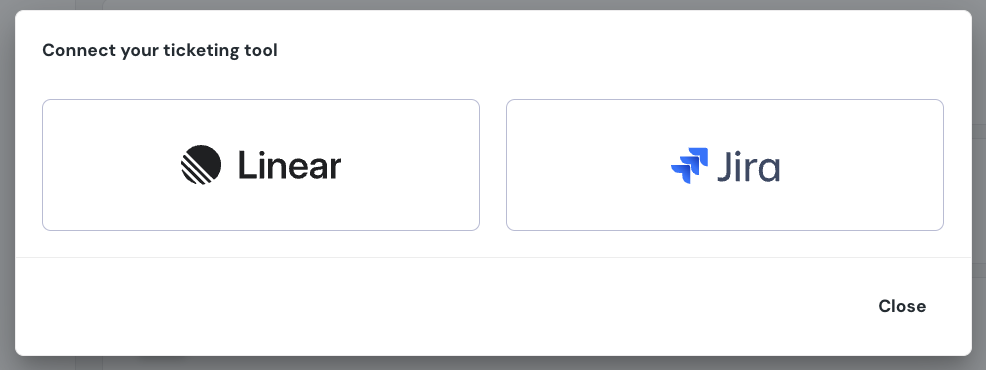
Release v0.20.0
What’s Changed:- Fix test dwh write dbt profiles
- Removed usage of deprecated
-mflag in dbt - Disable group registration when tracking is disabled
- Update dbt package revision
- Handle empty result in ClickHouse
- Handle invalid characters when uploading CI artifact
- Use row number instead of rank
- Add attribution block to alert messages in data monitoring
- dbt Fusion support
- CLI stop using deprecated tests
- Update the CLI to use the new package version
- Attempt to remove dbt-databricks restriction
- Update report version
- Feature: make the number of columns that are formatted as a table in Teams alerts a CLI flag so that users have more control over the formatting in Teams
Release v0.19.5
What’s Changed:- Slack join channel recursion fix
- Changed dbt package version to a commit with Dremio types mapping
- Enhance SlackWebMessagingIntegration to include a timeout feature
- Use sets for alert filters
- Dimension anomalies visualization
Release v0.19.4
What’s Changed:- Use full source name in freshness alerts
- Upgrade the elementary dbt package to v0.19.2
Release v0.19.3
What’s Changed:- Fixed package version
Release v0.19.2
What’s Changed:- Fixed backwards compatibility issue with pydantic
Release v0.19.1
What’s Changed:- Added excludes option to edr monitor
- Text and markdown formats
Release v0.19.0
What’s Changed:- Enable support for multiple links and icons in alert messages
- Using elementary 0.19.0
- dbt-databricks must be below 1.10.2 (See issue 1931 for more details)
Release v0.18.3
What’s Changed:- Fixed missing metrics in CLI
Release v0.18.2
What’s Changed:- Subscribers in the grouped alerts
- ClickHouse CLI integration
- Add FileSystemMessagingIntegration and related tests
- Adds —s3-acl option to the CLI to be able to set S3 report permissions
- Fixed setup of internal dbt project used by Elementary
- Add function for
disable_elementary_logo_print - Update report to 1.0.26
Release v0.18.1
What’s Changed:- Athena now works in the CLI
- Allow contributor PRs to run tests
- Add NOT_CONTAINS filter type
Release v0.18.0
What’s Changed:- Invocation Filter Fix: Invocation filters now apply to both reports and their summaries, ensuring consistent filtering
- Python Version Support: Official support for Python 3.8 has been discontinued to align with dbt’s supported versions
- Test Description Bug: Fixed an issue where test descriptions were missing in alerts when using dbt version 1.9
Release v0.17.0
Release notes coming soon.Release v0.16.1
Release notes coming soon.Release v0.16.0
Release notes coming soon.Compact navbar
You can now minimize the navigation bar for a better experience on smaller screens.
Sigma integration
Elementary now connects with Sigma! With this integration, Elementary automatically extends data lineage down to the workbook page and element level. This means you’ll have full end-to-end visibility into your data, making it easier to understand downstream dependencies, also known as exposures. Learn more about connecting to Sigma.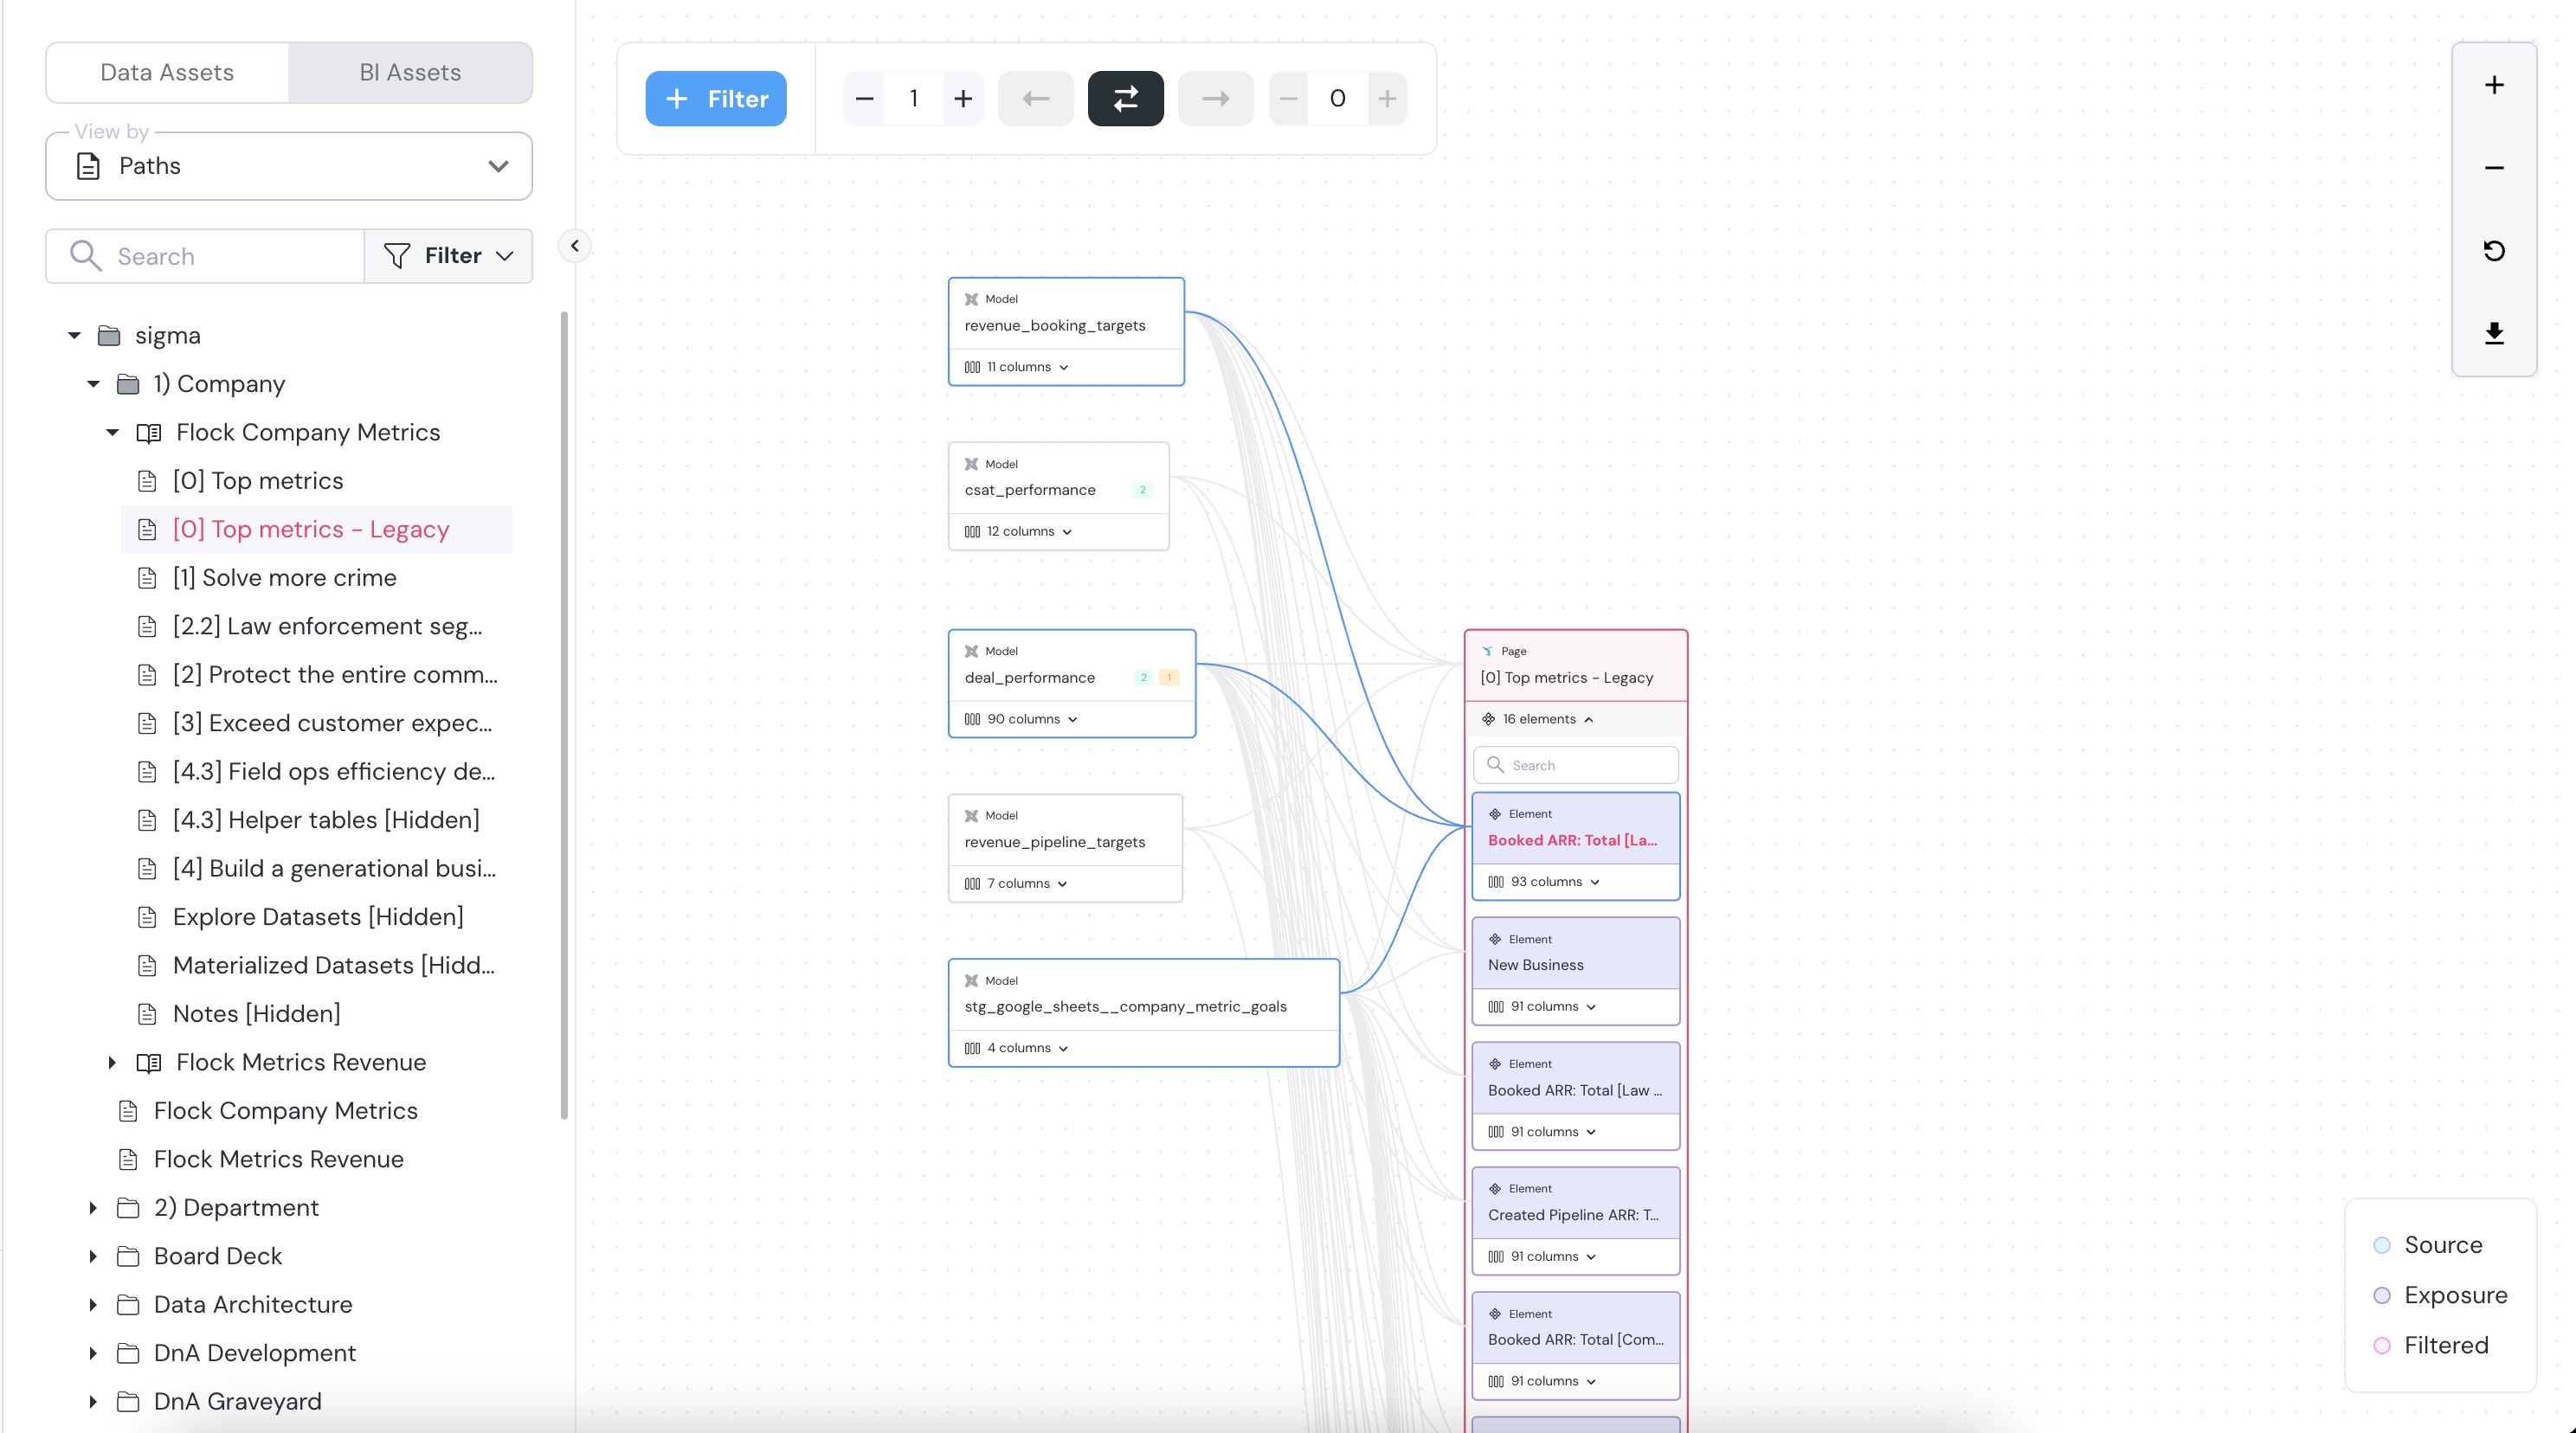
Performance improvements
In the past few months, we have made significant performance efforts to improve loading times within our platform. In particular, we created dedicated and efficient GraphQL API endpoints in our backend to speed up the dashboard, which now loads in a couple of seconds and usually less. We have also made considerable efforts to improve our database infrastructure to support additional scale and customers, which has resulted in an overall improvement throughout the platform.Lineage Export
Before making changes to a column or any other asset, you can assess the impact by exporting a textual summary of its lineage as a .csv file. The export includes:- Upstream and downstream assets
- Number of hops
- Names, owners, and tags of each dependency
Enhanced Test Results
The test overview side panel, previously only accessible from the incidents page, is now available on the test results page as well. This means you can view a full test overview even for tests that aren’t failing, not just for incidents. We’ve also introduced several updates to the panel:- View asset dependencies directly in a table format, with the option to export them as a .csv file or explore the lineage graph.
- Inspect the asset in the catalog with a single click.
- Disable automated freshness or volume tests directly from the test overview screen.
Custom Resource-based Roles
Elementary now allows the creation of custom roles with access controls tailored to specific data. These roles are based on criteria such as environments, model path, dbt tags, or dbt owners. This is in addition to the existing access control (View, Edit, Admin). This ensures that users can only access the data they need, helping create focus and security. For now, our team will create the custom role for you. In the future, you will be able to do this on your own in the UI. To create a custom role reach out to us in the mutual Slack support channel, and we will create it for you. When the role is created, it will appear in the roles dropdown you see when inviting a new user to Elementary.Bitbucket
You can now connect Elementary to your Bitbucket code repository, where your dbt project code is managed. Once connected, Elementary will open PRs with configuration changes. https://docs.elementary-data.com/cloud/integrations/code-repo/bitbucketPower BI
You can now connect Power BI to Elementary! This will provide you with end-to-end data lineage to understand your downstream dependencies. Once connected, Elementary will automatically and continuously extend the lineage to the report/dashboard level. https://docs.elementary-data.com/cloud/integrations/bi/power-biElementary + Atlan: See your Elementary data quality insights in Atlan!
We introduced a new test overview side panel that will make it much easier to investigate incidents. This overview is available directly from the Incidents Management screen and will soon be available from additional screens (test results, test coverage). The new view includes the complete test configuration and execution history, and for each result, it includes the result description, test query, and a row sample/anomaly chart (depending on the test type) This new side panel is also available for model build error incidents, allowing you to view dbt model build error messages right in the Elementary UI for the first time!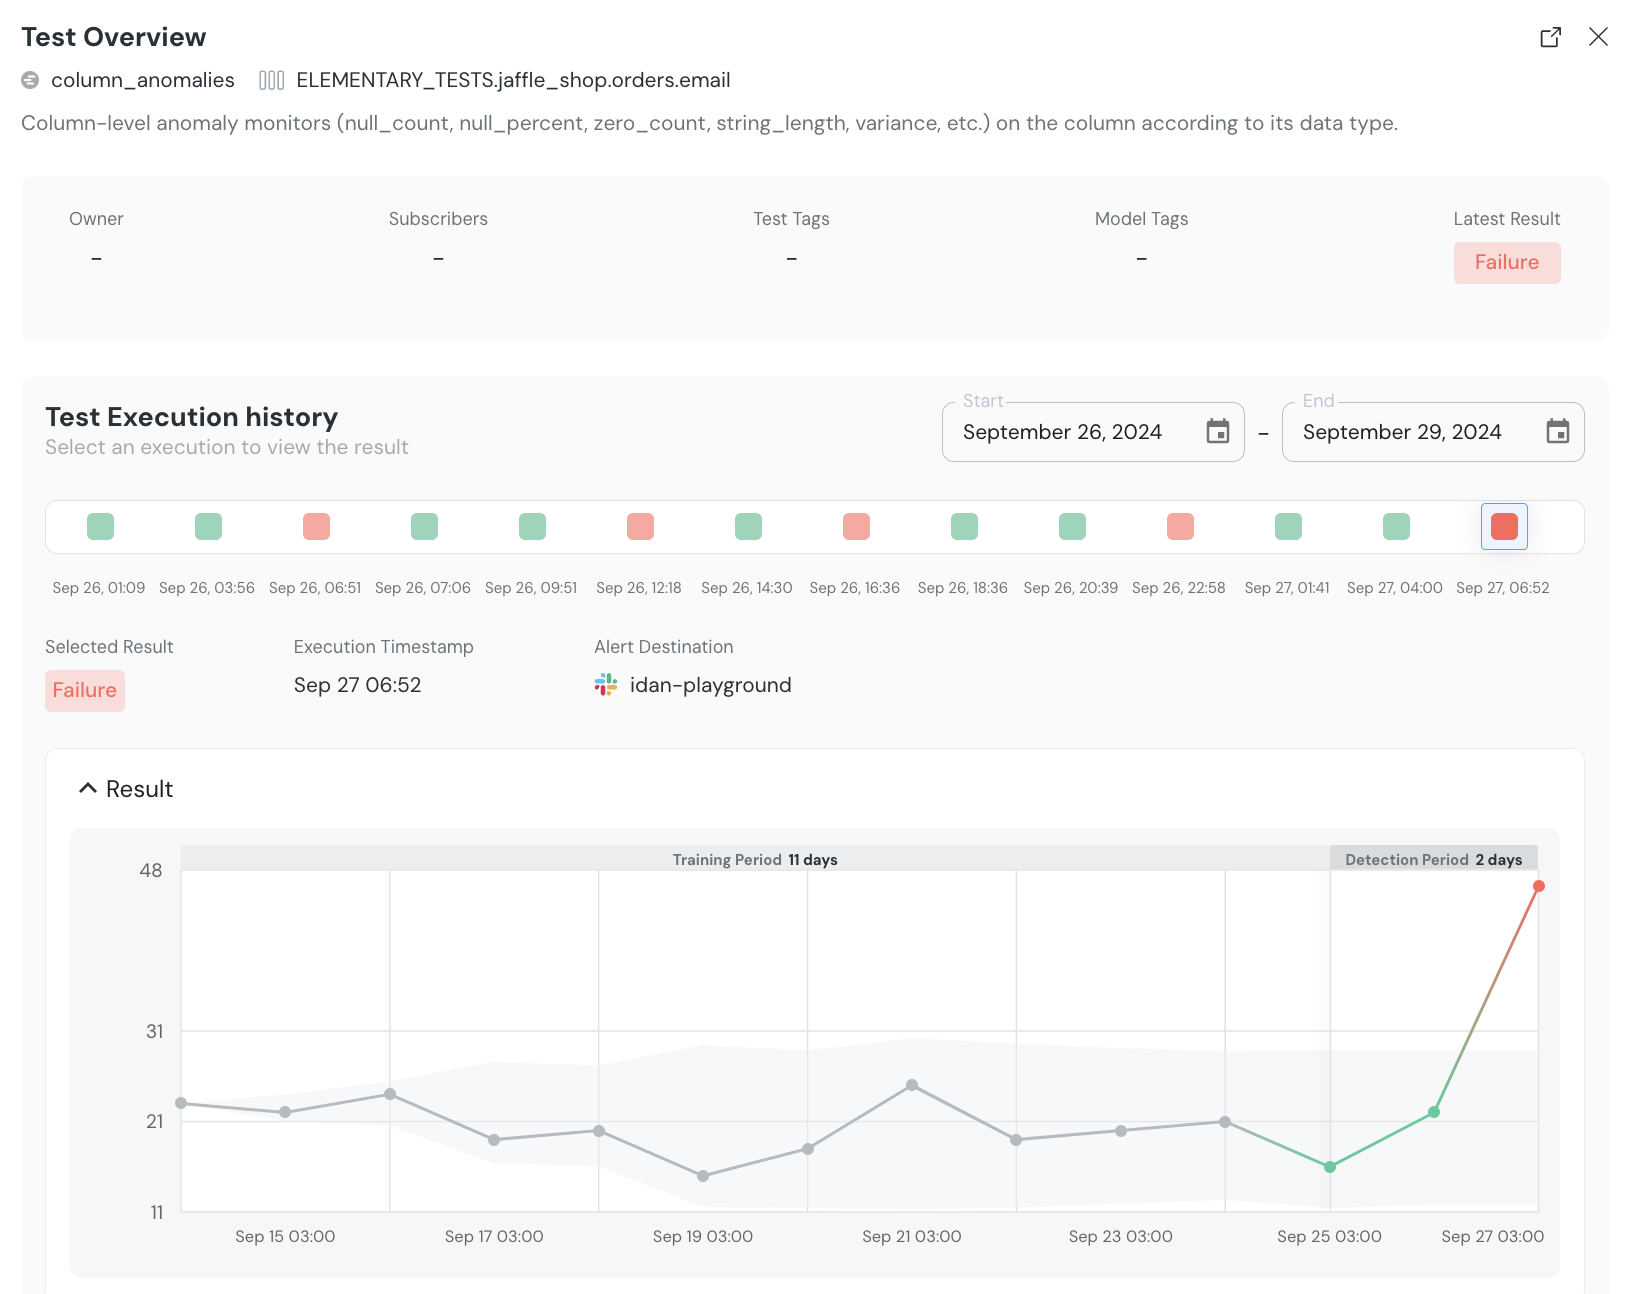
A better way to triage test and model failures
We introduced a new test overview side panel that will make it much easier to investigate incidents. This overview is available directly from the Incidents Management screen and will soon be available from additional screens (test results, test coverage). The new view includes the complete test configuration and execution history, and for each result, it includes the result description, test query, and a row sample/anomaly chart (depending on the test type) This new side panel is also available for model build error incidents, allowing you to view dbt model build error messages right in the Elementary UI for the first time!
Introducing: Incident Management
Managing alerts is a common challenge for our users. Daily test failures generate numerous alerts, making tracking each issue’s status difficult. Alerts are just the starting point—users need a tool to manage the entire process. We’ve been working hard to solve these issues and are excited to introduce incidents in Elementary. What are Incidents?An incident consists of one or more failure events. Each failure or warning opens a new incident or is added to an existing one. Different failures are grouped based on automated linking rules. Each incident has a start time, status, severity, assignee, and end time. Read more about Incidents. New Incident Management Page Our new Incident Management Page helps your team stay on top of open incidents and collaborate to resolve them. It provides a comprehensive overview of all incidents, allowing users to view statuses, prioritize issues, assign responsibilities, and resolve incidents efficiently.
New Alert Integrations!
Introducing three new integrations with communication and incident management tools: - Microsoft Teams - PagerDuty - OpsgenieAdd any dbt test via UI
Elementary now supports adding any dbt test in bulk and directly from the UI! We added support for dbt-expectation and dbt-utils packages, and you can use it to add your own custom generic tests to tables and columns.Column anomalies by dimensions
You can now add a new parameter to your column anomaly tests -dimensions.
This will calculate the column metrics for every time bucket and table dimension values, allowing you to detect anomalies in specific segments of your data.
For example, if you want to detect anomalies in a revenue column and you have multiple apps in different countries - now you can detect anomalies in revenue in a specific country.
Here is an example of how this can be configured -
Column level test results in lineage
You can now investigate test results right on top of your column level lineage graph. With this new release you can filter the lineage graph on a specific column that has an issue, and see if upstream or downstream columns have similar test failures to understand the root cause fast.Monitor test durations
We added test durations to the Test Execution History (the command and control center for your tests). You can now monitor your tests performance and see which tests are taking the longest or if there was any degradation in performance of specific tests. Easily sort your tests by execution duration and see which ones are taking the longest and choose the most promising candidates for optimization. This can also be used for cost analysis as slow tests tend to be more expensive. Check it out:Sync now
We are excited to launch a newSync Now button right in your environments page. You can think of is as a “refresh now” button for your environment.
If you introduced a change in your environment and you want to see it in Elementary immediately - just click ‘sync now’.
Here is what it looks like -
Status and assignee for alerts
An alert is just the start of a triage and response process. We have big plans for making this process much more effective. The first step was alert rules, and now we are introducing status and assignee selection in our alerts. This should help you manage incidents and collaborate more effectively with your team.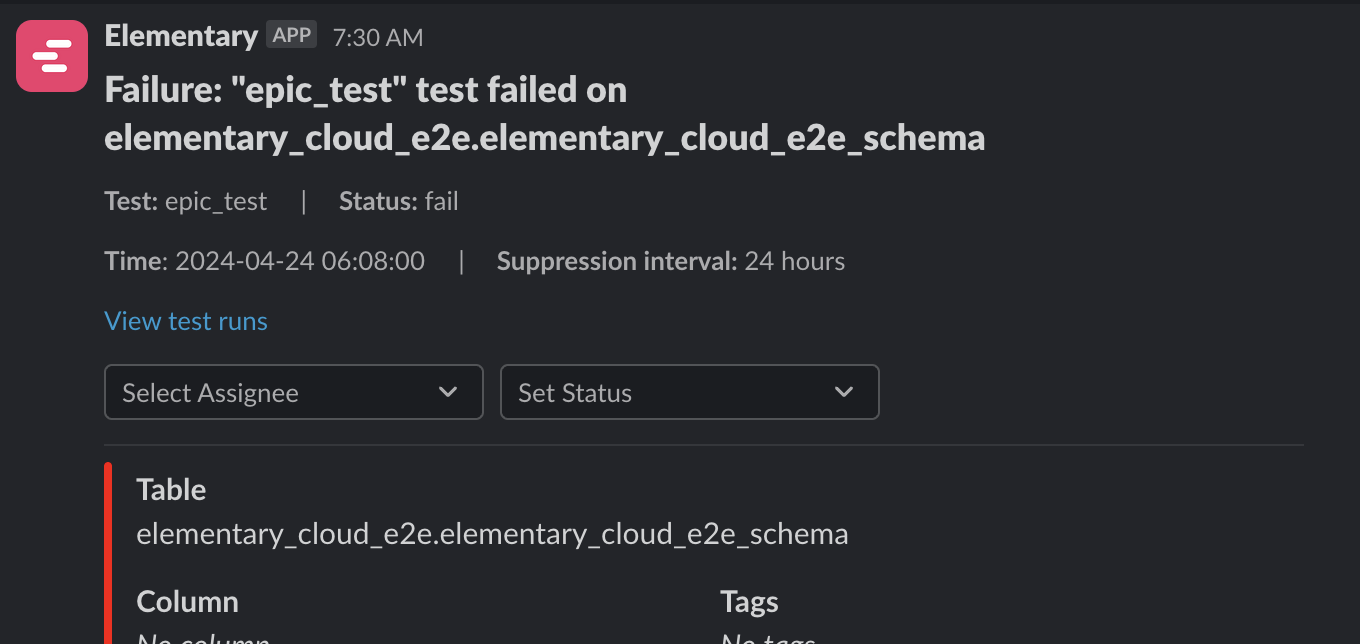
Custom SQL tests in UI
Custom query testing is a must-have to validate business logic specific to your data team. You can now create custom SQL tests with Elementary, which will be translated into singular tests in your dbt project.
Model runs in dashboard
The results of your jobs are critical to the data health. These are now included in the Elementary dashboard, for you to get a complete overview of the status of your pipelines. We added a breakdown of the latest result of each model, and the aggregated failures over time.
DAG subset in Lineage
To improve UX and performance, we changed the default behavior in the lineage. When a node or group of nodes is chosen, only the first hop in both directions is loaded. To see the rest of the hops you can use the +/- buttons (see video).
Role-based access control
Elementary now allows creating users with different roles. This will allow you to add more users from your team to Elementary, allowing them to view results without giving them the ability to change environment settings.